


Для построения на плоскости кривых, заданных уравнениями вида  , служат следующие функции:
| Plot[f,{x,xmin,xmax}] Plot[{f1,f2,…},{x,xmin,xmax}] ListPlot[{{x1,y1},{x2,y2},…}] Show[g1,g2,…] | Строит график функции f aргумента x в интервале от xmin до xmax. Строит графики ряда функций. Изображает графически список данных Изображает нескольких графиков на одном чертеже с наложением их друг на друга. |
| Show[GraphicsArray[{g1,g2,…}]] ParametricPlot[{f,g},{t,a,b}] ParametricPlot[{{f1,g1},{f2,g2},…}, {t,a,b}] | Изображает нескольких рядов графических объектов рядом на одной горизонтальной линии.
Строит кривые, заданные на плоскости параметрическими уравнениями  , где параметр , где параметр  Строит несколько кривых на одном чертеже.
|
Функция Plot применяется также для построения графиков интерполяционных функций, получающихся с помощью NDSolve (см. гл.5). В этом случае для их вычисления следует использовать команду Evaluate.
Заметим, например, что от задания плоской кривой в полярных координатах  можно перейти к заданию этой кривой параметрическими уравнениями в прямоугольных декартовых координатах с помощью формул
  и затем воспользоваться графической функцией ParametricPlot.
Примеры:
1) Построим график функции  с использованием опций: GridLines –строит линии сетки графика (по умолчанию None, т.е. опция не используется) PlotRange – указывает какие точки включать в график (по умолчанию задано Automatic), Ticks – устанавливает метки для осей графика (по умолчанию задано Automatic), опция PlotStyle устанавливает стиль отображения графика, Dashing[{N,M} ] позволяет начертить линию, состоящую из циклически чередующихся отрезков и пробелов длины N и M.


2) Представим массив данных графически


Директива AbsolutePointSize[d] построит точки графика в виде кругов с радиусом d (в пикселях)
3) Построим три синусоиды:  на одном чертеже (совместить можно было бы и с помощью функции Show[f1,f2,…]).


4) Построим плоскую кривую, заданную в полярных координатах уравнением 


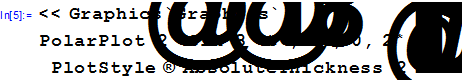
Mathematica может строить кривые, заданные в полярных координатах, и другим способом, подключая пакет Graphics`:
<<Graphics` Graphics`.
Пакет Graphics` относится к пакетам, которые содержатся в дополнениях, расширяющих систему Mathematica. В ряде случаев функции пакетов позволяют выполнять операции, отсутствующие в ядре системы.
5) Используя функцию PolarPlot[f(t),{t,tmin,tmax} ] построим трехлепестковую розу 

Если применить PlotStyle  {RGBColor[0,1,0]} график станет зеленым, а если PlotStyle {RGBColor[1,0,0]}, то красным.
3.2. Построение трехмерных графиков
Для визуализации поверхностей, заданных в трехмерном пространстве уравнениями или массивами данных, служат встроенные графические функции.
| Plot3D[f,{x,xmin,xmax}, {y,ymin,ymax}] ParametricPlot3D[{fx,fy,fz}, {t,tmin,tmax},{u,umin,umax}] ListPlot3D[{{z11,z12,…}, {z21,z22,…},…}] | Строит трехмерный график для аналитически заданной функции f(x,y) переменных x и y, изменяющихся в заданных пределах.
Строит трехмерную поверхность, параметризованную по t и u в заданных пределах их изменения.
Графически представляет массив дискретных данных, интерпретируя каждое  как аппликату точки, абсцисса которой x=i, а ордината y=j; эти точки изображаются вместе с двумерной поверхностью, их соединяющей. как аппликату точки, абсцисса которой x=i, а ордината y=j; эти точки изображаются вместе с двумерной поверхностью, их соединяющей.
|
Примеры:
1) Построим график функции двух переменных  , применим опции: AxesLabel – устанавливает отметки на осях графиков (по умолчанию None), PlotLabel –выводит титульную надпись для графика (по умолчанию None).


2) Пример построения трехмерной поверхности, параметризованной по u и v, опция PlotPoints задает количество точек, участвующих в построении


Характерной чертой трехмерного стиля является заключение графика функции в коробочку (бокс), от которой можно избавиться с помощью опции Boxed ® False.
Упражнения:
1) Построить график функции  для
для  .
.
2) Построить кривую, заданную параметрическими уравнениями 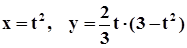 .
.
3) Построить графики функций y1, y2, y3 в одной координатной плоскости. Сделать вывод об их относительном расположении:
а)  ;
;
б)  ;
;
в)  ;
;
г)  .
.
4) По графику функции определить, является ли она четной или нечетной:
а)  ;
;
б) 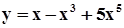
5) Построить поверхность, заданную уравнением  , где
, где  и
и  .
.
6) Построить поверхность, заданную уравнением  , где
, где  и
и  .
.
7) Построить тор (его параметрические уравнения fx=cos(t)(3+cos(u)), fy=sin(t) (3+cos(u)), fz=sin(u)).
8) Построить сферу, заданную параметрическими уравнениями

где  ,
,  .
.
9) Выяснить, какой геометрический объект описывают уравнения:
а)  ;
;
б)  ;
;
в)  ;
;
г)  .
.
10) Построить следующие кривые, заданные в полярных координатах:
а) кардиоиду  ;
;
б) циссоиду  ;
;
в) гиперболическую спираль  .
.
Символьные вычисления

