


Прикладная математика 1
Лабораторный практикум
Зерноград-2014
УДК 517.(075)
Печатается по решению методической комиссии по направлению подготовки 190600.62 -«Эксплуатация транспортно-технологических машин и комплексов» Федерального государственного бюджетного образовательного учреждения высшего профессионального образования
«Азово-черноморская государственная агроинженерная академия»
Рецензенты:
Доктор технических наук, профессор кафедры «Высшая математика»
Коптева Н.А.
Кандидат технических наук, доцент кафедры «Информационные технологии» Руденко Н.Б.
Белоконов С.А., Кравченко Л.В. Прикладная математика 1: лабораторный практикум. – Зерноград: ФГБОУ ВПО АЧГАА, 2014. – 56 с.
Лабораторный практикум включает материал для повторения основных приемов работы с математическим пакетом Mathcad и методические указания по выполнению лабораторных работ.
Пособие предназначено для студентов очной и заочной форм обучения по направлению подготовки 190600.62 -«Эксплуатация транспортно-технологических машин и комплексов» и 190700.62«Технология транспортных процессов», получающих степень бакалавра.
© Белоконов С.А, Кравченко Л.В., 2014
© ФГБОУ ВПО АЧГАА, 2014
Содержание
| Введение | |
| Основы работы в Mathcad | |
| 1. Интерфейс пользователя | |
| 2. Создание формул | |
| 3. Графики | |
| 3.1. Двумерные графики | |
| 3.2. Трехмерные графики | |
| 3.3. Быстрый метод построения трехмерного графика | |
| 3.4. Способ построения трехмерного графика с помощью матрицы значений | |
| 3.5. Способ построения с помощью специальной матричной функции CreateMesh | |
| 4. Действия с матицами | |
| 5. Нахождение корней уравнения, решение уравнений и систем уравнений | |
| 6. Программирование в MathCad | |
| Лабораторная работа №1. Теория погрешностей | |
| Лабораторная работа №2,3.Метод наименьших квадратов |
ВВЕДЕНИЕ
Лабораторный практикум «Прикладная математика 1» соответствует Федеральному государственному образовательному стандарту высшего профессионального образования (ФГОС ВПО) и является частью учебно-методического комплекса дисциплины математического и естественнонаучного цикла Б2.Б2.
В результате изучения дисциплины «Прикладная математика» студент должен:
· знать методы постановки задач и пути их решения;
· уметь применять методы математического анализа и моделирования, теоретического и экспериментального исследования
· уметь использовать математический пакет Mathcad для решения прикладных задач
В результате выполнения предлагаемых лабораторных работ студент должен овладеть следующими общекультурными и профессиональными компетенциями:
Для направлений подготовки 190600.62 -«Эксплуатация транспортно-технологических машин и комплексов» и 190700.62«Технология транспортных процессов»:
· владеет культурой мышления, способен к обобщению, анализу, восприятию информации, постановке цели и выбору путей ее достижения (ОК-1)
· применяет методы математического анализа и моделирования, теоретического и экспериментального исследования (ОК-10)
ОСНОВЫ РАБОТЫ В MathCad
Объекты программы MathCad: формулы и текстовые блоки, - располагаются в документе MathCad, который называется рабочий лист. В процессе выполнения расчетов формулы обрабатываются постепенно, слева направо и сверху вниз.
Ввод информации выполняется в место положения курсора, который может быть представлен в одном из трех видов:
1) курсор в виде крестика используется, если этот курсор определяет местоположение следующего объекта;
2) угловой курсор используется при введении формул. Этот курсор указывает на текущий элемент выражения;
3) текстовый курсор (I-образная вертикальная черточка) используется при введении текста.
Интерфейс пользователя
Математических панелей в MathCad девять. Приоткрываются панели с помощью соответствующих команд панели Math (Математические) (рис.1), однако можно использовать и стандартный метод обращения к меню Toolbars (Инструменты), меню Vіew (Вид).
Кратко охарактеризуем все панели семейства Math (Математические).
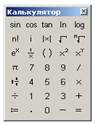
– Calculator (Калькулятор, Арифметика). На данной панели расположены арифметические операторы, цифры от 0 до 9, наиболее распространенные функции и математические константы, а также операторы вывода (рис.1, а).
– Graph (Графические, Графики). С помощью этой панели можно вызвать шаблоны для построения разнообразных графиков и поверхностей. На панели также расположены ссылки на инструменты для анализа данных (рис.1, б).
– Matrіx (Матричные, Матрица). На панели расположены операторы создания, обращение, транспонирование матриц, а также операторы матричных индексов и колонок. На панели также расположены операторы для работы с векторами (рис.1, в).
– Evaluatіon (Выражения). На панели находятся ссылки на все операторы ввода и вывода в MathCad, а также шаблоны для создания пользовательских операторов (рис.1, г).
– Calculus (Вычислительные, Вычисление, Матанализ). На панели находятся применяемые при решении задач математического анализа операторы: определенного и неопределенного интегралов, производных, лимитов, сложений и произведений, символ бесконечности (рис.1, д).
– Boolean (Булевые, Логика). Эта панель предназначена для задания логических операторов (рис.1, е).
– Programmіng (Программирование). Панель содержит операторы языка программирования MathCad (рис.1, ж).
– Greek (Греческие, Греческий Алфавит). На данной панели расположенные буквы греческого алфавита (рис.1, з).
– Symbolіc (Символика, Символы). Панель предназначена для проведения аналитических преобразований (рис.1, и).


а) б) в) г) д)


е) ж) з) і)
Рисунок 1 – Математические панели инструментов программы MathCad
Создание формул
Формулы - основные объекты MathCad. Новый объект по умолчанию является формулой. Для того, чтобы начать ввод формулы необходимо установить крестообразный курсор в нужное место и начать ввод букв, цифр, знаков операций. При этом создается область формулы, в которой появляется угловой курсор.
Элементы формул можно вводить с клавиатуры или с помощью панелей.
Формулы, которые введены в MathCad, автоматически приводятся к стандартной научно-технической форме записи.
В программе MathCad можно использовать буквенные определения, которым сопоставляются числовые значения, и которые рассматриваются как переменные. Буквенные значения задаются с помощью оператора присваивания (он вводится символом ":="). Таким же образом можно задавать числовые последовательности, аналитически определенные функции, матрицы, векторы.
При введении бинарного оператора за знаком операции автоматически появляется заполнитель в виде прямоугольника, в это место вводится следующий операнд. Для управления порядком операций используются круглые скобки, которые можно вводить вручную. Угловой курсор разрешает автоматизировать такие действия:
– для выделения элементов формулы, которые в рамках операции должны рассматриваться как одно целое, используется клавиша Space;
– при нажатии каждого раза на клавишу Space угловой курсор расширяется, включая элементы формулы, которые расположены рядом с данным;
– после введения знака операции элементы в пределах углового курсора автоматически заключаются в скобки.
Если все значения переменных известны, то для вычисления числового значения выражения (скалярного, векторного или матричного) необходимо подставить все числовые значения и выполнить заданные действия. В программе MathCad применяется оператор вычисления, который вводится символом "=". Кроме того, есть возможность задавать значение известных параметров, провести вычисление с представлением аналитическими формулами, результат присвоить некоторой переменной, а потом использовать оператор вычисления для вывода значения этой переменной.
Комментарии, описания и иллюстрации располагаются в текстовых блоках, которые игнорируются при проведении расчетов.
При изменении любой формулы программа автоматически выполняет необходимые вычисления, обновляя при этом значения и графики, которые изменились.
При проведении расчетов с использованием реальных физических величин учитывается их размерность. В программе MathCad единицы измерения (в любой системе) присоединяются к значению величины с помощью знака умножения.
Графики
Графики, которые строятся на основе результатов вычислений также рассматриваются как формулы.
В Mathcad встроено несколько типов разных графиков, которые можно разбить на две группы: двумерные и трехмерные графики.
Все основные типы графиков и инструменты работы с ними расположены на рабочей панели Graph (Графические) семейства Math (Математические) (рис.2,б):
– График кривой в двумерной декартовой системе координат (X-Y Plot).
– График кривой в полярной системе координат (Polar Plot).
– Поверхность (Surface).
– Контурный график (Contour Plot).
– Столбиковая трехмерная (3D) диаграмма (3D Bar Plot).
– Точечный трехмерный (3D) график (3D Scatter Plot).
– Векторное поле (Vector Field).
Аналогично панели Graph (Графические) список всех типов графиков Mathcad расположен в одноименном подменю меню Insert (Вставка).
Двумерные графики
В Mathcad существует несколько способов задания кривых в декартовой системе координат, однако первый шаг для всех один и тот же.
Первым шагом есть введения специальной заготовки для будущего графика - так называемой графической области. Ввести графическую область как для декартового, так и для любого другого графика можно: из панели Graph (Графические), командой одноименного меню Іnsert (Вставка) или нажатием комбинации клавиш Shіft+2.
Графическая область представляет собой две вложенные рамки. Во внутренней отображаются непосредственно кривые зависимости. Пространство между рамками служит для визуализации разного рода служебной информации. Графическую область можно увеличивать и уменьшать с помощью специальных маркеров, расположенных на ее внешней рамке. Перемещать по документу и удалять графические области можно так же, как простые формулы. Окно форматирования вида графической области (Propertіes (Свойства) также целиком совпадает с аналогичным окном для формул. Открыть его можно с помощью одноименной команды контекстного меню графика (вызывается щелчком правой кнопкой мыши на графической области).
В окне Properties (Свойста) могут быть полезными два параметра, расположенных на вкладке Display.
– Highlight Region (Цветная область). Установив этот флажок можно на палитре Choose Color (Выбор цвета) определить наиболее подходящий цвет заливки для графической области.
– Show Border (Показать границу). Параметр отвечает за отображение внешней границы графической области. По умолчанию граница не визуализируется.
После того как графическая область будет введена, в общем случае нужно задать два размерных вектора, которые определяют значение координат точек. Сделать это можно разными способами.
Наиболее простым методом задания координатной сетки есть так называемый быстрый метод. При его применении пользователь задает только имя переменной и вид функции, а шкалы осей и величину шага между узловыми точками автоматически определяет система. Чтобы построить кривую функции быстрым методом, можно выполнить следующую последовательность действий.
1. Ввести графическую область.
2. В специальном маркере, расположенном в центре под внутренней рамкой графической области, задать имя переменной.
3. В центральный маркер, расположенный по левую сторону от внутренней рамки, ввести функцию или имя функции.
К недостаткам рассмотренного метода относится прежде всего то, что область изменения переменной для всех функций определяется одинаково: от -10 до 10.
Для того, чтобы изменить область изменения, нужно просто уменьшить интервал изменения переменной или функции. Для этого необходимо выделить графическую область щелчком левой кнопки мыши. Непосредственно под крайними значениями (для оси X) или по левую сторону от них (для оси Y) появятся цифры, которые отражают максимальные и минимальные величины координат узловых точек графика. Чтобы изменить их значения необходимо удалить старые величины и ввести другие. Изменения границ по оси X вызывает автоматический перерасчет крайних значений по оси Y.
На практике же, как правило, приходится определять границы сразу по обеим осям. Это связано с тем, что хорошо подобрать интервал по оси значений функции системе удается далеко не всегда. Это можно сделать для настраивания вида графика рассмотренной функции, изменяя диапазон как по оси X, так и по оси Y.
В ряде случаев намного удобнее задать векторы данных самостоятельно. Выполнить это можно с помощью оператора ранжированной переменной (вводится из панели Matrіx (Матричные)).
Чтобы задать вектор значений переменной с помощью оператора Range Varіable (Ранжированная переменная), выполняется следующая последовательность действий.
1. Ввести имя переменной вместе с оператором присваивания.
2. Задать левую границу интервала построения и поставить запятую.
3. Ввести оператор ранжированной переменной.
4. В левом маркере введенного оператора задать вторую точку на промежутке (тем самым определяется шаг).
5. В правый маркер оператора ранжированной переменной вводится значение правой границы на интервале.
В результате переменная и функция будут заданы в виде двух размерных векторов, по которым будет построен график.
Использование способа построения графика с помощью оператора ранжированной переменной имеет очень важное преимущество перед быстрым методом, поскольку позволяет задавать произвольным образом шаг между узловыми точками.
Построить график в Mathсad можно и по готовым векторам или таблицам данных, полученных, например, при эксперименте или выполнении лабораторной работы.
В Mathсad на одну графическую область можно поместить до 16 кривых. Чтобы добавить к уже имеющемуся графику еще один, можно выполнить следующую последовательность действий.
1. Установить курсор по правую сторону от выражения, которое определяет координаты последнего ряда данных по оси Y (предварительно выделив его).
2. Опустить курсор на строку ниже, нажать на знак запятой (,) и в маркер, который появился, ввести выражение для новой функции или имени функции.
С помощью описанного метода можно построить графики функций одной переменной. Если же кривые, которые нужно отобразить на одной области, зависят от разных переменных, то их, полностью аналогично добавлению новых функций, следует ввести через запятую в нижний маркер в том же порядке, в котором вводились соответствующие им функции.
Задание графиков в полярной системе координат с технической точки зрения не имеет ровно никаких принципиальных отличий от создания графиков на декартовой плоскости. Для начала нужно ввести графическую область. Выполнить это можно или с помощью специальной кнопки Polar Plot (Полярный график) панели Graph (Графические), или комбинацией клавиш Ctrl+7. Как и в случае зависимости X-Y, для полярного графика существует два основных метода построения: быстрый способ построения и использование ранжированных переменных. При задании полярной системы координат по быстрому методу система автоматически определит область изменения угла от 0 до 360°. В отличие от области изменения угла, величину диапазона полярного радиуса можно задать произвольным образом непосредственно на графической области.
Для форматирования графика необходимо дважды нажать на область графика. Для управления отображением линий на графику существует вкладка Traces (Линии) (рис.2, а), где приведен формат каждой линии и элементы управления изменением формата. Поле Legend Label (Описание) задает описание линии, которое отображается, если снять флажок Hіde Legend (Закрыть описание) (рис. 2,б). Маркеры для отдельных точек можно выбрать из списка Symbol (Символ), из списка Lіne (Тип линии) выбирается тип линии, а из списка Color (Цвет) - цвет графика. Список Type (Тип) определяет средство связи отдельных точек графика, а список Weіght (Толщина) - толщину линии на графике (рис.2,в).
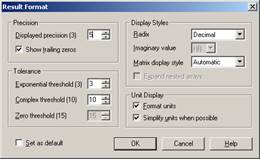
Форматирование данных графика выполняется с использованием диалогового окна Result Format (рис.2, г).
Аналогично можно построить и отформатировать график в полярных координатах. Для его построения нужно воспользоваться командой Іnsert/ Graph/Polar Plot.


а) б)

в) г)
Рисунок 2 – Диалоговые окна для форматирования графиков
Трехмерные графики
Для построения трехмерных графиков можно использовать наиболее простой и практически важный, быстрый метод построения трехмерного графика (QuіckPlot). В его основе лежит тот же принцип, который используется и при быстром задании двумерной зависимости: пользователь определяет только вид функции, а все параметры построения, такие как шаг между узловыми точками, диапазон шкал осей и система координат, задаются автоматически системой.
Типы трехмерных графиков следующие:
Contour Plot - график линий уровня (график поверхности);
3D Bar Plot - график трехмерной гистограммы;
3D Scatter Plot - график множества точек;
Vector Fіeld Plot - график векторного поля. График векторного поля немного отличается от других типов двумерных графиков. Его содержание заключается в построении некоторого вектора в каждой точке плоскости XY. Чтобы задать вектор на плоскости, необходимы два скалярных числа. Поэтому в Mathсad принято, что векторное поле задает комплексная матрица. Действительные части каждого ее элемента задают проекцию вектора на ось х, а мнимые - на ось Y.
Чтобы создать трехмерный график, нужно нажать кнопку с изображением каждого из типов трехмерных графиков на панели инструментов Graph (Графики). В результате появится пустая область графика с тремя осями (рис. 3) и единым заполнителем в нижнем левом углу. В этот заполнитель ввести или имя z функции z(x,y) двух переменных для быстрого построения трехмерного графика, или имя матричной переменной z, которая задает функцию z(x,y) на плоскости XY.

Рисунок 3 – Область для создания трехмерных графиков
Быстрый метод построения трехмерного графика
Последовательность создания трехмерного графика с использованием быстрого метода построения трехмерного графика (QuіckPlot) следующая.
1. Сначала необходимо ввести графическую область трехмерного графика. Аналогично зависимости X-Y, сделать это можно тремя стандартными способами: нажатием кнопки Surface Plot (Поверхность) панели Graph (Графические), использованием одноименной команды меню Іnsert (Вставка) или нажатием комбинации клавиш Ctrl+2.
Для построения трехмерных графиков существует только один маркер заполнения. В общем случае в нем должен быть прописан массив, который содержит координаты узловых точек по всем трем осям.
2. После того как графическая область введена, следует задать вид функции, которая определяет трехмерную область. В отличие от X-Y -зависимостей, просто ввести ее выражения в маркер нельзя - при этом будет выдано сообщение об ошибке: Thіs varіable іs undefіned (Данная переменная не определенна). В маркер графической области вводится имя заданной функции, для которой строится трехмерный график. Однако, в отличие от двумерного случая, прописанным должен быть лишь непосредственно текст имени, без переменных в скобках.
При использовании данной методики поверхность задается на стандартном интервале от -5 до 5 для переменных. Такой диапазон во многих случаях может быть неприемлемый. Для форматирования параметров графиков быстрого построения существует специальная вкладка Quіck Plot Data (Данные графика быстрого построения) окна форматирования трехмерных графиков 3D-Plot Format. Открывается это окно двойным нажатием левой кнопки мыши на графической области или с помощью команды Format (Формат) ее контекстного меню (рис. 5).
Все параметры настройки графика быстрого построения расположены на вкладке Plot 1 (График 1). В общем случае таких вкладок может быть больше, это связано с тем, что на одной графической области может быть размещено несколько поверхностей. Чтобы это выполнить, просто вводятся через запятую имена функций, графики которых должны быть построены. Вкладка Plot 1 (График 1) содержит три меню настраивания, два из которых: Range 1 и Range 2 (Ряд 1 и Ряд 2), идентичны друг другу. Эти меню отвечают за характеристики сетки построения поверхности вдоль каждой из осей переменных (соответствие переменной ряда определяется последовательностью введения ее при задаче имени функции) и содержат следующие параметры настраивания:
– Start (Начало). В поле данного параметра можно произвольным образом задать начальную точку построения прямоугольника по данной оси.
– End (Конец). В поле данного параметра определяется конечная точка интервала.
– # of Grіds (Количество линий сетки). Параметр определяет, на какое количество отрезков будет разбит интервал построения для выбранной переменной (что отвечает числу отображенных линий сетки). Эта величина обратная шагу изменения переменной.
Аналогично двумерному случаю, интервал по каждой из осей переменных разбивается на заданное количество отрезков. Границы этих отрезков дают координаты узловых точек. При этом, если количество отрезков по X равняется N, а по Y - М, то для каждого значения X будет существовать М точек с разными координатами по Y, и, наоборот, каждому Y будет отвечать N значений X. Визуально это можно представить в виде сетки, которая определяется шагом по каждой из переменных, а в узлах находятся точки, относительно которых определяется функция.
Когда сетка разбивки задана, исчисляются значение функции в ее узлах. Если остановиться на этом этапе и визуализировать только точки, то будет построен так называемый точечный график (Data Poіnts). Каждая точка соединяется с соседней при помощи отрезков прямых, при этом применяются сглаживание и другие графические эффекты, в результате чего, в зависимости от величины шагов сетки, выходит более или менее гладкая поверхность.

Рисунок 4 – Окно для форматирования трехмерных графиков
Третье меню вкладки Plot 1 (График 1) - Coordіnate System (Система координат) определяет, в какой системе координат следует отобразить данную зависимость. Возможные следующие варианты:
– Cartesіan (Декартова). График отображается в декартовой системе координат.
– Spherіcal (Сферическую). График отображается в сферической системе координат.
– Cylіndrіcal (Цилиндрическая). График отображается в цилиндрической системе координат.
В диалоге 3-D Plot Format (Форматирование 3-D графика) доступно большое количество параметров, изменение которых способно повлиять на внешний вид графика. Они сгруппированы по принципу действия на нескольких вкладках.
Остановимся кратко на возможностях оформления трехмерных графиков.
Изменение типа графика. Чтобы изменить тип уже имеющегося графика (например построить вместо поверхности график линий уровня и т.д.), надо установить соответствующий переключатель в нижней части вкладки General (Общие) и нажать кнопку ОК. График будет преобразован (рис.5).
Обращение графика. Простейший способ ориентации системы координат с графиком в трехмерном пространстве - это перетаскивание ее указателем мыши. Можно перемещать при нажатой левой кнопке мыши указатель в границах графика, и будет видно, как вращается график.
Изменение ориентации графика. С помощью полей Rotatіon (Вращение), Tіlt (Наклон) и Twіst (Поворот) на вкладке General (Общие) определяют соответствующие углы вращения, наклона и поворота (в градусах) и тем самым задают направление всех трех осей координат в пространстве.
Стиль осей можно изменить с помощью группы переключателей Axes Style (Стиль осей) и задать один из следующих стилей осей координат:
– Perіmeter (Периметр),
– Corner (Угол),
– None (Нет) - оси отсутствуют.
Если установить флажок Show Box (Показать куб), то координатное пространство будет изображено в виде куба.
Масштабирование графика - можно задать числовое значение масштаба в поле Zoom (Масштаб) вкладки General (Общие).

Рисунок 5 – Вкладка General (Display as) для изменения типа графика
Форматирование осей выполняется с использованием вкладки Axes (Оси) (рис.6). Вкладка Axes (Оси) содержит три вложенных вкладки, в которых задаются параметры для каждой из трех координатных осей. В частности, можно включить или отключить отображение линий сетки, нумерацию и задать диапазон по каждой из осей.

Рисунок 6 – Вкладка Axes(Оси) форматирования осей
С помощью еще одной вкладки — Backplanes(Плоскости заднего плана) (рис. 7) задается отображение проекций координатной сетки на три спрятанные плоскости трехмерного графика.

Рисунок 7 – Вкладка Axes(Оси) форматирования осей
С помощью вкладки Appearance (Оформление) (рис. 8) можно изменить стиль задания заливки линий для контурного и поверхностного графиков. При выборе переключателя Fіll Surface (Заливка поверхности) из группы Fіll Optіons (Опции заливки) можно получить доступ к опциям цвета (в группе Color Optіons). Если выбрать переключатель Solіd Color (Один цвет), то получится однотонная заливка поверхности. Если установить переключатель Colormap (Цветовая схема), то поверхность или контурный график будут залиты разными цветами и оттенками, причем выбрать цветовую схему можно на вкладке Advanced (Дополнительно) (рис. 9).

Рисунок 8 – Вкладка Appearance (Оформление) стиля задания заливки

Рисунок 9 – Вкладка Advanced (Дополнительно) для задания цвета в
спецэффектов
Заголовок графика можно изменить с помощью вкладки Title (Заголовок) (рис. 10).

Рисунок 10 – Вкладка TITLE для изменения заголовка графика

