


Для размещения разного рода надписей на полученном рисунке применяют функции xlabel (предназначена для размещения названия горизонтальной оси, ориентированного вдоль оси координат), ylabel (предназначена для размещения названия вертикальной оси, ориентированного вдоль оси координат), title (предназначена для задания общего заголовка графика), text (предназначена для размещения надписи в произвольном месте рисунка) и legend (размещение легенды). В качестве примера приведем обращение вида
>> text(x,y,'Sample Text')
где x, y – координаты нижнего левого угла прямоугольника, в котором размещается отображаемый текст (по умолчанию координаты задаются в тех же единицах измерения, что и координаты, указанные на горизонтальной и вертикальной осях).
Следует также отметить команду
grid on
используя которую можно нанести координатную (измерительную) сетку на всю область построения графика.
Легенда позволяет вносить ясность при визуализации нескольких графиков. Рассмотрим, в частности, следующий пример (рис. 2.10.4):
>> x=0:0.001:2*pi;
>> y1=cos(x);
>> y2=sin(x);
>> plot(x,y1,'-',x,y2,'-.')
>> legend('cos(x)','sin(x)',3)
>> xlabel('Coordinate x');
>> ylabel('Coordinate y');
>> grid on
>> title('Functions cos(x), sin(x)')
Заметим, что третий параметр в команде legend (впрочем, данный параметр можно указать в любом месте списка) управляет размещением легенды в графическом окне:
– при значении параметра равном -1 легенда размещается вне поля графика вверху справа;
– при значении параметра равном 0 система выбирает наилучшее место в поле графика, не перекрываемое данными;
– при значении параметра равном 2 легенда размещается в левом верхнем углу поля графика;

Рис. 2.10.4. Графики функций с подписями, легендой и сеткой.

Рис. 2.10.5. Пример графиков с двойной оцифровкой осей.
– при значении параметра равном 3 легенда размещается в левом нижнем углу поля графика;
– при значении параметра равном 4 легенда размещается в правом верхнем углу поля графика.
В некоторых случаях визуализация двух графиков в общем окне (совмещение) может вызвать проблемы, обусловленные тем, что диапазоны изменения аргументов или значений функций не совпадают. Для разрешения этих проблем в системе MATLAB можно использовать функцию
plotyy, которая производит двойную оцифровку осей. Для первой из отображаемых в окне функций цифруются ось  внизу, а ось
  слева, для второй функции – ось размещается вверху, а ось справа, причем цвет оцифровки совпадает с цветом кривых. Итак, можем записать (рис. 2.10.5):
>> x=0:0.001:2*pi;
>> y1=cos(x);
>> y2=5*sin(x);
>> plotyy(x,y1,x,y2)
Приведем еще один важный пример. Выполнив команды
>> x=0:0.001:2*pi;
>> y=cos(x);
>> plot(x,y);
>> title('Graph of Sample Function cos(x)');
>> xlabel('Coordinate x');
>> ylabel('Coordinate y');
>> text(4.0,-0.6,'\leftarrowcos(x)');
>> grid on
получим график функции  , представленный на рис. 2.10.6.
Заметим, что в представленном примере были использована специальные управляющие символы, введенные внутри текста после символа \ («обратная косая черта») «стрелка влево». Справочно можно отметить, что команды отображения специальных символов MATLAB совпадают с соответствующими командами системы подготовки научных текстов TeX. Так, например, для создания новой строки и вывода в нее текста применяется команда \newline.
Для того, чтобы установить шрифт, который будет использоваться для соответствующих надписей следует запомнить
>> htext=text(4.0,-0.6,'\leftarrowcos(x)');
Располагая дескриптором htext объекта типа text, можно изменять свойства его атрибутов. В частности, посредством команды
set(htext,'Color',[1 0 0],'FontSize',[18]);
изменит внешний вид ранее выведенной надписи – шрифт увеличится в размере, а сам цвет надписи станет красным.
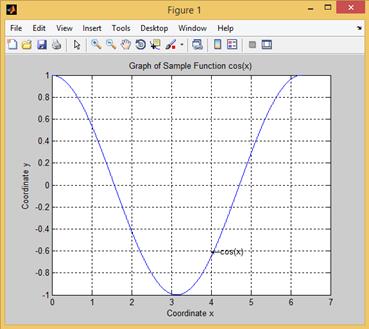
Рис. 2.10.6. Пример оформления графиков.
Завершая рассмотрение способов оформления графиков функций, укажем, как изменить цвет фона, на котором осуществляется построение графиков (по умолчанию установлен белый цвет). Для того, чтобы сделать цвет фона слегка красноватым, следует присвоить свойству Color объекту axes значение [0.8 0.5 0.5], при этом прежде всего необходимо получить описатель этого объекта:
>> haxes=gca;
Функция gca предназначена для поиска описателя текущего объекта axes. Отметим, что при наличии нескольких объектов типа axes в первую очередь следует щелкнуть мышью на том из них, который должен стать текущим, и лишь после этого вводить указанную выше команду.
Смена фона прямоугольника, содержащего графическое изображение соответствующей функциональной зависимости, осуществляется следующей командой:
>> set(haxes,'Color',[0.8 0.5 0.5]);
Для смены фона всего графического окна необходимо выполнять следующие команды:
>> FigureColor=[0.8 0.5 0.5];
>> hfigure=gcf;
>> set(hfigure,'Color',FigureColor);

