


Если для одиночного графика диапазоны изменения переменных вдоль одной или обеих осей координат слишком велики, то можно воспользоваться функциями построения графиков в логарифмическом и полулогарифмических масштабах. Для этого предназначены функции semilogx (логарифмический масштаб по оси  ), semilogy (логарифмический масштаб по оси
  ) и loglog (логарифмический масштаб по обеим осям). Синтаксис указанных функций аналогичен синтаксису функции plot: они принимают аргументы, заданные в виде пары векторов значений абсцисс и ординат.
Построим в качестве примера график функции  на промежутке
  в логарифмическом масштабе по оси .
Будем иметь (рис. 2.9.6):
>> x=0.1:0.001:1000;
>> y=3*cos(log(2*x));
>> semilogx(x,y)
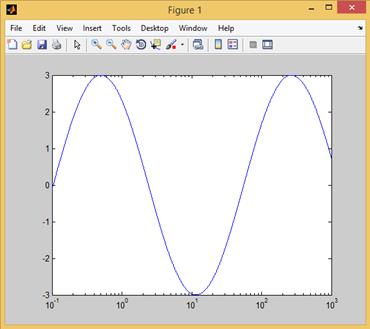
Рис. 2.9.6. График функции  в логарифмическом масштабе по оси .
Построение графиков в полярных координатах.
Для построения графика функции в полярной системе координат используется команда polar, например (рис. 2.9.7):
>> phi=0:0.001:2*pi;
>> r=sin(5*phi);
>> polar(phi,r);
Оформление графиков и графических окон
Функции построения графиков, рассмотренные в предыдущем параграфе осуществляли автоматическое оформление графиков. Разумеется у системы MATLAB имеются дополнительные возможности, связанные с управлением внешним видом графика – заданием цвета и стиля линий, а также размещение различных надписей в пределах графического окна.
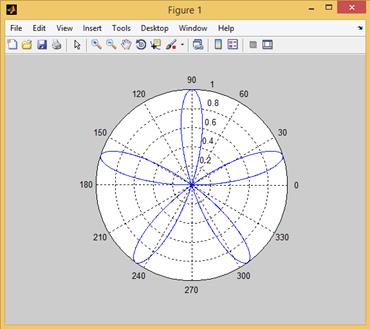
Рис. 2.9.7. График функции  в полярной системе координат.
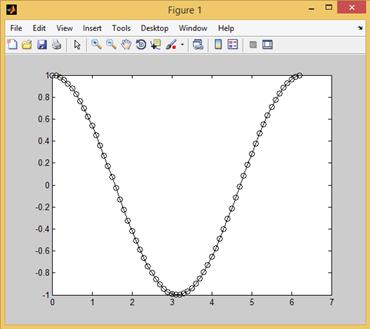
Рис. 2.10.1. Пример маркировки точек кривой посредством окружностей.
Выбор свойств линий.
Так, например, команды (рис. 2.10.1)
>> x=0:0.1:2*pi;
>> y=cos(x);
>> plot(x, y, 'k-', x, y, 'ko')
позволяют придать графику вид черной сплошной линии, на которой в дискретных точках, расстояние между которыми равно 0.1, проставляются черные окружности. Здесь функция plot дважды строит график одной и той же функции, но в двух разных стилях. Первый из этих стилей отмечен как “k-”, что обозначает проведение линии черным цветом (буква k), а штрих означает проведение сплошной линии. Второй стиль, помеченный как “ko”, обозначает проведение тем же черным цветом (буква k) окружностей (буква o) на месте вычисляемых точек.
В общем случае команда
plot(x1,y1,s1,x2,y2,s2,...)
позволяет определить в одном графическом окне изображения нескольких функций y1(x1),y2(x2),... используя стили s1,s2,....
Заметим, что стили s1,s2,... задаются в виде набора трех символьных маркеров (стилевой строки), один из которых задает тип линии, второй – цвет линии, а третий – тип маркера, используемого для пометки представляемых точек (таблица 2.10.1). При отсутствии указания типов маркеров используются значения, установленные по умолчанию. Отметим, что порядок, в которым указываются маркеры, задающие тип линии, цвет линии и тип точки несущественен. Если в стилевой строке задан тип маркера, но не указан тип линии, то представляемые точки маркером метятся, но не соединяются друг с другом отрезками прямых.
Более мощным способом построения графиков функций является ме тод дескрипторов, который относится к низкоуровневой графике MATLAB. Метод дискрипторов позволяет напрямую обратиться к базовым графическим объектам и задать его свойства. Детальное знакомство со свойствами графических объектов MATLAB выходит за рамки книги.
В этой связи приведем ниже некоторый пример, иллюстрирующий основные приемы работы с дискрипторной графикой и позволяющий продемонстрировать суть данного метода (рис. 2.10.2).
>> x=0:0.001:2*pi;
>> y=cos(x);
>> hplot=plot(x,y);
>> set(hplot,'LineWidth',8);
В данном случае команда plot через опорные точки проводит отрезки прямых линий с координатами x,y. Прямые линии в системе MATLAB представляют собой объекты типа line. Эти объекты имеют очень большое количество свойств и характеристик, которые можно менять. Доступ к этим объектам осуществляется посредством их дескрипторов.
Командой hplot=plot(x,y) создается графический объект и переменной hplot присваивается значение дескриптора графического объекта типа line, использованного для построения графика функции  .
.
Таблица 2.10.1. Параметры для управления цветом и видом графиков.
| Параметр | Обозначение (управляющий символ) |
| Тип линии | |
| сплошная (по умолчанию) | - |
| пунктирная | : |
| штриховая | -- |
| штрих-пунктирная | -. |
| Цвет линии | |
| красный (от англ. red) | r |
| желтый (от англ. yellow) | y |
| зеленый (от англ. green) | g |
| синий (от англ. blue) | b |
| голубой /циановый/ (от англ. cyan) | c |
| розовый /малиновый/ (от англ. magenta) | m |
| черный (от англ. black) | k |
| белый (от англ. white) | w |
| Тип маркера | |
| точка (жирная точка) | . |
| кружок | о |
| крестик (косоугольный крестик) | x |
| плюс (прямоугольный крестик) | + |
| звездочка (восьмиконечная снежинка) | * |
| квадратик | s |
| ромбик | d |
| отсутствие маркера | none |
| треугольник вершиной вниз | v |
| треугольник вершиной вверх | ^ |
| треугольник вершиной влево | < |
| треугольник вершиной вправо | > |
| пятиконечная звезда | p |
| шестиконечная звезда | h |
Затем данный дескриптор передается в качестве параметра функции set для опознания конкретного графического объекта и задания значений соответствующих свойств объекта.
В рассматриваемом примере было установлено значение свойства 'LineWidth' (толщина линии) равным 7 (по умолчанию 0.5). График, полученный в результате изменения толщины линии, представлен на рис. 2.10.2.
Текущее значение любого параметра (атрибута; характеристики) графического объекта возвращается функцией get. Так, например, если после получения показанного на рис. 2.10.1 графика выполнить команду
>> width=get(hplot, 'LineWidth')
width =
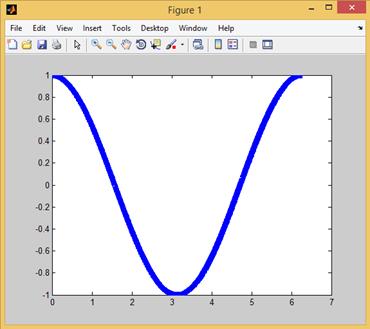
Рис. 2.10.2. График функции на интервале  (толщина кривой – 7 пикселей).
то для переменной width будет присвоено значение свойства 'LineWidth' равное 7.
Для получения списка всех свойств графического объекта следует обратиться к функции get, указав ей в качестве единственного параметра дескриптор объекта. Так, например, для дескриптора hplot объекта типа line можно найти весь список его свойств:
>> get(hplot);
DisplayName: ''
Annotation: [1x1 hg.Annotation]
Color: [0 0 1]
LineStyle: '-'
LineWidth: 7
Marker: 'none'
MarkerSize: 6
MarkerEdgeColor: 'auto'
MarkerFaceColor: 'none'
XData: [1x6284 double]
YData: [1x6284 double]
ZData: [1x0 double]
BeingDeleted: 'off'
ButtonDownFcn: []
Children: [0x1 double]
Clipping: 'on'
CreateFcn: []
DeleteFcn: []
BusyAction: 'queue'
HandleVisibility: 'on'
HitTest: 'on'
Interruptible: 'on'
Selected: 'off'
SelectionHighlight: 'on'
Tag: ''
Type: 'line'
UIContextMenu: []
UserData: []
Visible: 'on'
Parent: 173.0011
XDataMode: 'manual'
XDataSource: ''
YDataSource: ''
ZDataSource: ''
Среди свойств графического объекта с дескриптором hplot имеются интуитивно понятные. В частности, помимо уже рассмотренного свойства 'LineWidth', свойство 'Color' отвечает за цвет линии в RGB-кодировке (красный, зеленый, синий) и так как значение поля равно [0 0 1], то цвет линии синий, а свойство 'MarkerSize' определяет размер маркера точек графика (в данном случае равного 6). Установленные значения полей указываются в списке свойств справа от знака равно, при этом свойства, значения которых не установлены, отмечены пустым полем или знаком [].

