


Задание 3.
Построить полярный график. Исходные данные представлены на рис. 11. Линии и оси графиков оформить так, как показано на том же рисунке (см. п. 3.1.).
1. Для построения полярного графика необходимо выполнить команду Inset → Graph → Polar Plot. При этом в документ помещается графическая область с двумя незаполненными ячейками для построения графика. (Клавиши [Ctrl +7]).
2. В нижнюю ячейку вводится полярный угол θ. Его следует определить заранее как переменную, принимающую значения из промежутка (ранжированная переменая). В левую ячейку вводится полярный радиус r(θ) или Re(r(θ)) и Im(r(θ)). Функция r(θ) либо задается заранее, либо ее определение вводится непосредственно в ячейку.
3. График в полярных координатах можно построить и посредством команды X-Y Plot. Только в этом случае необходимо дополнительно задать следующие функции: x(θ)=r(θ)cos(θ) и y(θ)=r(θ)sin(θ), а в ячейках для абсцисс и ординат указать соответственно x(θ) и y(θ).
4. Если для некоторых углов θ функция не определена (не существует радиуса с действительным значением, он принимает чисто мнимые значения), то MathCAD отображает на графике только действительные значения радиуса. Но при помощи функций Re и Im можно представить на одной круговой диаграмме графики как действительной, так и мнимой части функции r(θ).

Рис. 11. Полярный график, построенный в MathCAD
3.1. Форматирование полярных графиков
Если вы хотите отредактировать график в полярных координатах, необходимо выделить график (щелчком левой кнопки мыши) и выполнить команду Format → Graph → Polar Plot или выполнить двойной щелчок на выделенном графике. При этом откроется окно Formatting Currently Selected Polar Plot (форматирование полярного графика). Это окно содержит те же вкладки, что и для графиков в декартовой системе координат.
Вкладка Polar Axes содержит следующие элементы (рис. 12):
- Log Scale (Логарифмическая шкала) – используется для создания логарифмической r -оси.
- Grid Lines (Вспомогательные линии) – отображает сетку линий, соответствующих уравнениям r=const и q=const.
- Numbered (Нумерация) – линии r=const и q=const снабжаются подписями.
- Show Markers (Показать метки) – при помощи этой опции можно снабдить график двумя дополнительными пунктирными окружностями r=const. Для этого надо ввести нужные значения радиуса в появившиеся ячейки. Кроме того, справа от графика указывается минимальный и максимальный радиус; можно увеличить или уменьшить график, введя в эти ячейки собственные значения.
- Auto Grid (Автосетка) – при установке этой опции число линий сетки определяет MathCAD.

Рис. 12. Вкладка Polar Axes диалогового окна
Formatting Currently Selected Polar Plot
Остальные значения параметров на этой вкладке и на других вкладках те же самые, что и в случае команды X-Y Plot.
IV. Построение графика функции z = f (x,y) в виде поверхности в декартовой системе координат
Задание 4.
Построить график функции  . Оформить, как показано на рис. 13.

Рис. 13. График функции z = f (x,y) в виде поверхности
в декартовой системе координат, построенный в MathCAD
1. Если вам надо только посмотреть общий вид поверхности, то MathCAD предоставляет возможность быстрого построения подобных графиков. Для этого достаточно определить функцию f (x, y) и выполнить команду Insert → Graph → Surface Plot или нажать соответствующую кнопку наборной панели Graph (сочетание клавиш [Ctrl+7]).
2. В появившейся графической области под осями на месте шаблона для ввода надо указать имя (без аргументов) функции. MathCAD автоматически построит график поверхности. Независимые переменные x и y принимают значения из промежутка [-5,5].
При необходимости этот промежуток может быть уменьшен или увеличен. Для этого необходимо выделить график и воспользоваться командой Format → Graph → 3D Plot (рис. 14) или щелкнуть правой кнопкой мыши по выделенному графику и в контекстном меню выбрать команду Format. В появившемся окне 3-D Plot Format на вкладке QuickPlot Data можно установить другие параметры изменения независимых переменных x и y.

Рис. 14. Вкладка QuickPlot Data
диалогового окна 3D Plot Format
Задание 5.
Построить график поверхности. Исходные данные представлены на рис. 15.
1. Для построения графика поверхности в определенной области изменения независимых переменных или с конкретным шагом их изменения необходимо сначала задать узловые точки xi и yj, в которых будут определяться значения функции. После (а можно и до) этого надо определить функцию f (x, y), график которой хотите построить. После этого необходимо сформировать матрицу значений функции в виде: A i,j = f (xi, yj).
2. Теперь после выполнения команды Insert → Graph → Surface Plot в появившейся графической области достаточно ввести имя матрицы (без индексов).
3. Если вы хотите, чтобы узловые точки были расположены через равные промежутки, воспользуйтесь формулами, изображенными на рисунке 14.

| 
|
| Рис. 15. График поверхности в определенной области изменения независимых переменных или с конкретным шагом их изменения, построенный в MathCAD |
Задание 6.
Построить график линий уровня, трехмерный столбчатый график, трехмерный график поверхности в виде в виде несвязанных квадратных площадок, используя данные из задания 5.
1. Для построения графика линий уровня данной функции необходимо поступать так же, как это было описано выше, только вместо команды (Поверхности) следует выбрать команду Contour Plot (Контурный) (рис. 16).
Рис. 16. График линий уровня для функции А,
построенный в MathCAD
| 2. Аналогично, при помощи команды 3D Bar Plot (3D Диаграммы) можно построить трехмерный столбчатый график данной функции, при помощи команды 3D Scatter Plot (3D Точечный) – трехмерный точечный график (рис. 17). 3. При помощи команды 3D Patch Plot (3D Лоскутный) – трехмерный график поверхности в виде несвязанных квадратных площадок – плоскостей уровня для каждой точки данных, параллельных плоскости X-Y (рис. 18). |
 Рис. 17. Трехмерный столбчатый график функции А, построенный
в MathCAD
Рис. 17. Трехмерный столбчатый график функции А, построенный
в MathCAD
|  Рис. 18. Трехмерный график поверхности в виде несвязанных квадратных площадок функции А, построенный в MathCAD
|
V. Построение графика поверхности, заданной параметрически
Задание 7.
Построить график поверхности, заданной параметрически. Исходные данные представлены на рис. 19.

Рис. 19. Исходные данные для задания 7
1. Если поверхность задана параметрически, это означает, что все три координаты – x и y и z - заданы как функции от двух параметров u и v. Сначала необходимо задать векторы значений параметров ui и vj. Затем необходимо определить матрицы значений функций координат x(u,v), y(u,v) и y(u,v).
2. После выбора команды Surface Plot в MathCAD документе появится графическая область. В свободной ячейке внизу области надо указать в скобках имена (без аргументов и индексов) трех матриц – x, y, z.
3. Полученный в итоге график, представлен на рис. 20.

Рис. 20. График поверхности, заданной параметрически,
построенный в MathCAD
5.1. Форматирование трехмерных графиков
Если вас не устраивает внешний вид созданного трехмерного графика, вы можете изменить его, выполнив команду Format → Graph → 3D Plot или выполнив двойной щелчок мышкой на графической области. В результате на экране появится диалоговое окно 3-D Plot Format, позволяющее изменять параметры отображения графика. Мы рассмотрим здесь основные опции. Разобраться во всех тонкостях управлением видом графика вы можете самостоятельно, построив график и поэкспериментировав, выбирая те или иные опции.
Диалоговое окно 3-D Plot Format содержит несколько вкладок. Некоторые из них мы рассмотрим более подробно, а для других - опишем лишь их функциональное назначение.
На вкладке General (Общие свойства) (рис. 21) вы можете:
· в области View задать направление взгляда наблюдателя на трехмерный график. Значение в поле Rotation определяет угол поворота вокруг оси Z в плоскости X-Y. Значение в поле Tilt задает угол наклона линии взгляда к плоскости X-Y. Поле Zoom позволяет увеличить (уменьшить) графическое изображение в число раз, равное цифре, указанной в поле.
· в области Axes Style (Стиль оси) задать вид осей, выбрав селекторную кнопку Perimetr (Периметр) или Corner (Угол). В первом случае оси всегда находятся на переднем плане. При выборе кнопки Corner точка пересечения осей Ox и Oy задается элементом A0,0 матрицы A.
· в области Frames опция Show box (Каркас) предназначена для отображения вокруг графика куба с прозрачными гранями, а опция Show border (Границы) позволяет заключить график в прямоугольную рамку.
· в области Plot 1 (Plot 2...) Display as (График/ несколько графиков Отобразить как) - имеются селекторные кнопки для представления графика в друих видах (контурный, точечный, векторное поле и др.)

Рис. 21. Вкладка General диалогового окна 3-D Plot Format
Элементы вкладки Axes (Ось) позволяют изменять внешний вид осей координат (рис. 22).

Рис. 22. Вкладка Axes диалогового окна 3-D Plot Format
Посредством опций области Grids (Сетки) можно отобразить на графике линии, описываемые уравнениями x,y,z = const.
Если установлены опции Show Numbers (Нумерация), отображаются метки на осях и подписи к ним.
При этом рядом с осями Ox и Oy указываются не значения узловых точек xi, yj, а значения индексов i и j, в то время как ось Oz размечается в соответствии с промежутком, которому принадлежат элементы матрицы значений Ai,j.
· Если установлена опция Auto Grid (Автосетка), программа самостоятельно задает расстояние между соседними отметками на осях. Вы можете сами указать число линий сетки, если отключите указанную опцию.
· Если установлена опция Auto Scale (Автошкала), то MathCAD сам определяет границы построения графика и масштабы по осям. Можно отключить данную опцию и для каждой оси самостоятельно задать пределы изменения переменных в полях Minimum Value (Минимум) и Maximum Value (Максимум).
Вкладка Appearance (Внешний вид) позволяет изменять для каждого графика вид и цвет заливки поверхности (область Fill Options); вид, цвет и толщину дополнительных линий на графике (область Line Options); наносить на график точки данных (опция Draw Points области Point Options), менять их вид, размер и цвет.
Вкладка Lighting (Освещение) при включении опции Enable Lighting (Наличие подсветки) позволяет выбрать цветовую схему для освещения, «установить» несколько источников света, выбрав для них цвет освещения и определив его направление.
Вкладка Backplanes (Задние плоскости) позволяет изменить внешний вид плоскостей, ограничивающих область построения: цвет, нанесение сетки, определение ее цвета и толщины, прорисовка границ плоскостей.
На вкладке Special (Специальная) можно изменять параметры построения, специфичные для различных типов графиков.
Вкладка Advansed позволяет установить параметры печати и изменить цветовую схему для окрашивания поверхности графика, а также указать направление смены окраски (вдоль оси Ox, Oy или Oz). Включение опции Enable Fog (Наличие Тумана) делает график нечетким, слегка размытым (полупрозрачным). При включении опции Perspective (Перспектива) появляется возможность указать в соответствующем поле расстояние до наблюдателя.
Вкладка Quick Plot Data обсуждалась ранее в начале раздела.
VI. Кривая в пространстве
Трехмерные точечные графики можно использовать для построения изображения пространственных кривых. Пространственные кривые задаются, как правило, в виде (x (t) ,y (t) ,z (t)), где t представляет собой непрерывный действительный параметр.
Задание 8.
Построить пространственную кривую. Исходные данные представлены на рис. 23.
| 1. Поскольку при построении трехмерной точечной диаграммы MathCAD позволяет отображать на графике только отдельные точки и соединяющие их линии, необходимо сначала определить три вектора координат – xi, yi, zi. Чтобы данные из предыдущих заданий не влияли на результат, построение графика начните с нового листа!. |  Рис. 23. Исходные данные для задания 8.
| ||
| 2. Пространственная кривая создается командойInsert3D → Graph → Scatter Plot(рис. 24). Можно использовать наборную панель Graph, выбрав соответствующую пиктограмму. Для соединения точек необходимо на вкладке Appearance окна форматирования графиков указать опцию Line. |  Рис. 24. Пространственная кривая,
построенная в MathCAD
Рис. 24. Пространственная кривая,
построенная в MathCAD
| ||
VII. Векторные и градиентные поля
Задание 9.
Построить векторное поле. Исходные данные представлены на рис. 25.

Рис. 25. Исходные данные для задания 9
1. Команда Insert → Graph → Vector Field Plot (Поле векторов) служит для представления двумерных векторных полей v=(vx, vy).
2. При этом векторное поле необходимо сначала определить как вектор-функцию двух координат - x и y. Затем задаются векторы значений узловых точек x и y. При помощи этих векторов компоненты векторного поля vx(x,y) и vy(x,y) генерируются в виде матриц значений vxi, j и vyi, j.
3. Полученный в итоге график представлен на рис. 26.
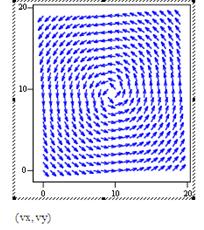
Рис. 26. Векторное поле,
построенное в MathCAD
Задание 10.
Построить градиентное поле. Исходные данные и график представлены на рис. 27.
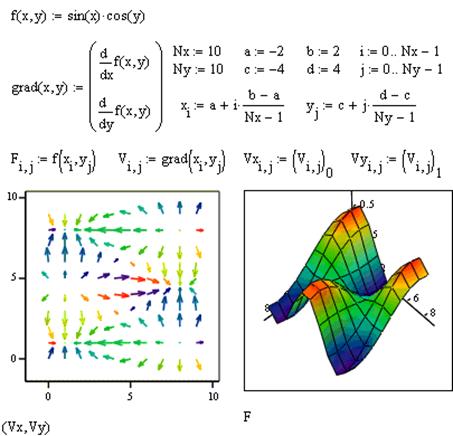
Рис. 27. Исходные данные для задания 10
и полученные изображения градиентных полей
1. Способом, описанным выше, можно построить градиентное поле скалярной функции f (x,y). Градиентное поле для функции двух переменных представляет собой двумерное векторное поле.
Как и в остальных случаях, внешний вид изображения векторного поля можно легко изменить, выполнив двойной щелчок в области графика и изменив требуемые опции в открывшемся диалоговом окне 3-D Plot Format.
VIII. Поверхности, полученные вращением кривых вокруг осей
Интересные объемные фигуры можно получить, вращая некоторую кривую вокруг той или иной оси. Построение этих фигур вращения сродни параметрически заданным поверхностям.
Задание 11.
Построить объемные фигуры, вращением кривой, представленной на рис. 28 вокруг оси Х и оси Y.
 Рис. 28. Исходная кривая для задания 11
| 1. Необходимо обеспечить пересчет координат точек фигуры по известным из геометрии формулам. В MathCAD встроена функция CreateMesh, с помощью которой можно построить параметрически заданные поверхности. |

Рис. 29. Объемные фигуры, полученные вращением кривой
вокруг оси Х и оси Y
IX. Анимация в MathCAD
Начиная с 6-й версии, в MathCAD появилась возможность создавать анимации. Для ее создания строим график функции командой X-Y Plot из подменю Graph меню Insert. Для анимации задается промежуток изменения целочисленного параметра FRAME (по умолчанию от 0 до 9).
Этот параметр должен входить в определение функции, график которой вы хотите пронаблюдать при изменении какого-то параметра (на самом деле вы можете определить свой параметр произвольным образом, лишь бы в нем присутствовал счетчик кадров Frame).
Задание 12.
Построить график, представленный на рис. 30. Выполнить анимацию.

Рис. 30. Исходный график
для задания 12.
Для создания анимации необходимо выполнить следующие действия:
1. Выбрать команду Animate из меню View. При этом появится диалоговое окно Animate (рис. 31).
2. Заключить построенный график в маркировочный прямоугольник.

Рис. 31. Диалоговое окно Animate
3. Задать минимальное и максимальное значения параметра FRAME (поля From и To).
4. Задать в поле At количество воспроизводимых кадров в секунду.
5. Выполнить щелчок на кнопке Animate. При этом в диалоговом окне вы увидите анимационные кадры.
 Рис. 32. Диалоговое окно
проигрывателя Playback
Рис. 32. Диалоговое окно
проигрывателя Playback
| 6. Чтобы воспроизвести анимацию щелкните на кнопке Play в появившемся окне Playback (Проигрыватель) (рис. 32). 7. Чтобы внести изменения в анимацию выполнить щелчок на кнопке открытия меню в окне Playback. 8. При помощи команды Save As можно сохранить анимацию в файле с расширением AVI. |
 Рис. 33. Воспроизведение
анимации графика
Рис. 33. Воспроизведение
анимации графика
| Встраивание анимации в Mathcad-документ производится при помощи Windows Explorer. Для этого необходимо: 1. Запустить Windows Explorer. 2. Выполнить в окне Windows Explorer щелчок на имени AVI-файла. 3. Перетащить AVI-файл в соответствующий Mathcad-документ. Воспроизвести анимацию можно посредством двойного щелчка в графической области (рис. 33). |
Анимацию можно также воспроизвести, выполнив двойной щелчок на динамически связанной с соответствующим AVI-файлом пиктограмме. Для того чтобы встроить такую пиктограмму в Mathcad-документ необходимо:
1. Выбрать команду Object из меню Insert.
2. Установить опцию Создать из файла.
3. Выбрать нужный AVI-файл при помощи кнопки Обзор.
4. Установить опции Связь и В виде значка, после чего выполнить щелчок на кнопке OK.
Рис. 34. Диалоговое окно Вставка объекта
При создании анимационных картинок надо отключить все опции автоматического масштабирования графиков и перейти к ручному заданию масштаба. Автоматическое изменение масштаба может привести к скачкообразному изменению размеров графика, хотя на деле он должен меняться без скачков, с дискретностью, определяемой только изменением FRAME=1,2,3... и т.д.
ВАРИАНТЫ ЗАДАНИЙ
Построение графиков функций, заданных явным выражением.
1. Задайте ранжированную переменную х, меняющуюся от 0 до 2 с шагом 0.1; определите функцию f (x) = x ∙sin(2 x)2, постройте ее график.
2. Определите изменение целого индекса i от нуля до 15, xi = i /10, yi = xi ∙sin(2 xi)2, постройте график функции yi (xi).
3. Постройте график функции g (x, y) = x 2 – y 2, где переменные x и y меняются от -5 до 5.
4. Изобразите сферу. Ее параметрическое представление имеет вид:
 ,
,  ,
,  ,
,

Число точек N = 30.
5. Анимация. Измените определение радиуса сферы R (f) = |cos(FRAMEf)|. Постройте анимационный график (число кадров равно 20, число кадров в секунду – 3. Просмотрите на Плеере получившуюся анимацию.
ВНИМАНИЕ! Перед построением анимации не забудьте отключить АВТОМАСШТАБ!
6. Постройте графики функций, заданных полярно:
 ,
,  ,
,
7. Изобразите пространственную кривую:
 ,
,  ,
,

8. Увеличьте число точек N, повторите построение предыдущего графика; поэкспериментируйте, меняя различные параметры отображения графика.
9. Построить поверхность Z =e x / a (x + y 2); x  (-5;5); шаг 0,5; y (-5;5), шаг 0,5; a =2.
10. Построить поверхность Z = a ∙ln(bx 2 y 2+ c); x (-2;2), шаг 0,2; у (-2;2), шаг 0,2; a =2; b=3;c=0,01.
11. Постройте графики функций, заданных полярно:
N=45, φ меняется от 0 до 2π, с шагом 1/N.
12. Постройте график функции g(x,y) =x2 +y3+2x-20, где переменные x и y меняются от -5 до 5.
КОНТРОЛЬНЫЕ ВОПРОСЫ
1. Для чего нужен программный продукт Mathcad?
2. Какими возможностями обладает Mathcad?
3. Какие виды графических зависимостей можно построить?
4. Какие особенности существуют при работе с дисплеем и клавиатурой?
5. Как определить диапазонную переменную?
6. Как должны быть расположены относительно друг друга на листе определения переменных некоторого арифметического выражения и само арифметическое выражение.
7. На какие три области делится лист Mathcad?
8. Какие форматы файлов импортирует, а какие экспортирует Mathcad?
9. Какой знак используется для получения результата при проведении численных вычислений?
10. Какой знак используется для проведения символьных преобразований?
СПИСОК ЛИТЕРАТУРЫ
1. http://www.ugtu.krasnoturinsk.ru/metod/metodic;
2. Кирьянов Д. Самоучитель MathCAD 2001 / Д. Кирьянов. – Издательство: BHV-Санкт-Петербург, 2001. – 544 с.
3. Сдвижков О.А. Книга MathCAD -2000: Введение в компьютерную математику / О.А. Сдвижков. – Издательский дом Дашков и К, 2002 г. – 204 с.
Учебное издание

