


Задание 1.
Задайте ранжированную переменную х, меняющуюся от 0 до 2π с шагом 0,01. Построить график функции f (x) = sin(x). На графике дополнительно отобразить функцию f (x) = cos(x). Линии графика и оси оформить так, как показано на рис. 4 (см. п. 2.1.).
| 1. При выполнении команды Inset → Graph → Plot в документ помещается рамка-шаблон с двумя незаполненными ячейками для построения графика. (Клавиша [@]). 2. В ячейке, расположенной под осью абсцисс, указывается независимая переменная x. Ее следует определить заранее как переменную, принимающую значения из промежутка (ранжированная переменная) с определенным шагом. | 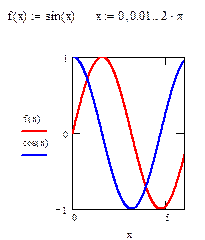 Рис. 4. Двумерный график
в декартовой системе координат,
построенный в MathCAD
Рис. 4. Двумерный график
в декартовой системе координат,
построенный в MathCAD
|
3. В ячейке рядом с осью ординат необходимо задать функцию f (x), график которой мы хотим построить. Если эта функция была определена заранее, то в ячейку достаточно ввести f (x), в противном случае следует ввести изображаемую функцию в явном виде (например, cos(x)).
4. После ввода x и f (x) в графической области появятся еще четыре ячейки, которые не обязательно заполнять. MathCAD автоматически находит подходящие значения для x min, x max, y min, y max. Если же предлагаемые MathCAD значения вас не устраивают, вы можете задать свои.
Примечания.
1. В MathCAD существует возможность строить график функции, не задавая предварительно промежуток изменения независимой переменной. По умолчанию этот промежуток принимается равным [-10, 10].
2. Для представления на одной диаграмме графиков нескольких функций необходимо выделить ячейку рядом с осью ординат и через запятую ввести вторую функцию. По умолчанию график этой функции будет представлен пунктирной линией другого цвета.
II. Кривые на плоскости, заданные параметрически
Уравнения x = f (t), y = y (t), где f (t) и y (t) непрерывны при t из (a, b), устанавливающие зависимость декартовых координат (x,y) точки плоскости от значения параметра t, определяют на плоскости кривую, заданную в параметрической форме.
Задание 2.
Построить кривую, заданную параметрически. Исходные данные представлены на рис. 5. Линии графиков и оси оформить так, как показано на рис. 5 (см. п. 2.1.).
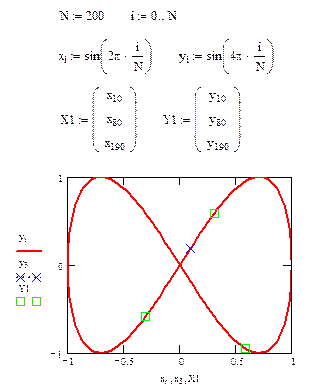 Рис. 5. Кривые на плоскости,
заданные параметрически,
построенные в MathCAD
Рис. 5. Кривые на плоскости,
заданные параметрически,
построенные в MathCAD
| 1. В случае построения параметрически заданной кривой, вместо независимой переменной x под осью абсцисс необходимо задать индексированную переменную xi. А рядом с осью ординат необходимо соответственно указать yi. 2. Для нанесения на график функции отдельных точек, их координаты указываются через запятую под осью абсцисс и слева от оси ординат. Если требуется вывести множество точек, то можно сформировать два вектора, один из которых содержит абсциссы точек, а другой - их ординаты. В этом случае на графике в соответствующих ячейках указываются только имена векторов. |
2.1. Редактирование графиков в декартовой системе координат
Если вас не устраивает внешний вид построенных графиков, вы можете его изменить, выделив график (выполнив на нем щелчок, так, чтобы вокруг него появилась рамка) и воспользовавшись командой Format → Graph → X-Y Plot, или, выполнив на графике щелчок правой кнопкой мыши и выбрав команду Format из выпадающего контекстного меню (можно выполнить также двойной щелчок левой кнопкой мыши). В результате на экране появится диалоговое окно Formatting Currently Selected X-Y Plot, позволяющее изменить вид графика (рис. 6).
Данное диалоговое окно содержит несколько вкладок: X-Y Axes (форматирование осей), Traces (тип линий графиков), Labels (подписи), Defaults (по умолчанию).
| Первая из вкладок позволяет форматировать оси координат (рис. 5): · Log Scale (Логарифмическая шкала) – задает логарифмические оси, в этом случае границы графика должны задаваться положительными числами. · Grid Lines (Вспомогательные линии) – задает отображение сетки из параллельных осям линий. · Numbered (Нумерация) – задает отображение подписи к маркировкам на осях. | 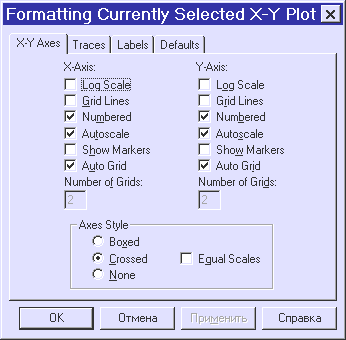 Рис. 6. Вкладка X-Y Axes диалогового окна Formatting Currently Selected X-Y Plot, позволяющая изменить вид графика
|
· Autoscale (Автомасштаб) – задает автоматическое нахождение подходящих границ для осей. Но если вы сами зададите в соответствующих ячейках минимальные и максимальные значения x min, x max, y min, y max, именно эти значения будут использоваться для определения границ графика.
· Show Markers (Показать метки) – если установить эту опцию, то в графической области появятся четыре дополнительные ячейки для создания красных линий маркировки, соответствующих двум специальным значениям x и двум специальным значениям y.
· Auto Grid (Автосетка) – при установке этой опции число линий сетки определяет MathCAD.
· Axes Style (Вид осей) – группа кнопок этой области позволяет выбрать следующие варианты представления осей: Boxed (ограниченная область), Crossed (пересечение) – оси пересекаются в точке с координатами (0.0), None (без границ). Флажок Equal Scales (равный масштаб) позволяет задать одинаковый масштаб для обеих осей.
Форматирование оси графика можно произвести, выполнив на ней двойной щелчок!
Для изменения типа линий графиков необходимо активизировать вкладку Traces (След) (рис. 7).
 Рис. 7. Вкладка Traces диалогового окна Formatting Currently Selected X-Y Plot, позволяющая изменить тип линии графиков
| · Legend Lable (Имя в легенде) – каждой кривой модно поставить в соответствие некоторый текст, называемый легендой. Легенда отображается в нижней части графической области, а рядом с каждой легендой отображается тип линии соответствующей кривой. · Symbol (Символ) – позволяет выбрать символ для каждой точки кривой (плюс, крестик, кружок и др.) |
· Line (Линия) - можно выбрать один из следующих типов линий: solid (сплошная), dash (штриховая), dot (точечная) или dadot (штрихпунктирная). Это поле списка доступно в случае, если в поле Type (Тип) выбран элемент lines.
· Color (Цвет) – задается цвет представления кривой на экране.
· Type (Тип) – позволяет выбрать один из семи видов графика: в виде кривых (), в виде столбцов () и т. п. Специальным видом графика является тип (погрешность, расхождение), представляющий собой разность двух заданных функций. Величина шага независимой переменной определяет расстояние между отдельными столбцами, ступенями или линиями погрешностей на диаграмме.
· Weight (Вес) – позволяет задавать толщину линий графика.
В нижней части вкладки Traces расположены опции:
- Hide Arguments (Скрыть аргументы) – эта опция по умолчанию отключена. В этом случае под именем функции рядом с осью ординат указывается текущий тип линий. Если установить данную опцию, указание типа линий исчезнет.
- Hide Legend (Скрыть легенду) – по умолчанию легенда не отображается. Если вы хотите отобразить под графиком текст легенды, его необходимо перед этим ввести в поле Legend Lable (Имя в легенде) и подтвердить ввод, выполнив щелчок на кнопке Применить.
| Вкладка Labels (Метки) позволяет ввести заголовок графика и подписи для осей (рис. 8). |  Рис. 8. Вкладка Labels диалогового окна Formatting Currently Selected X-Y Plot, позволяющая ввести
заголовок графика и подписи для осей
Рис. 8. Вкладка Labels диалогового окна Formatting Currently Selected X-Y Plot, позволяющая ввести
заголовок графика и подписи для осей
|
В подменю Graph (Графика) меню Format (Формат) содержатся кроме прочих следующие команды:
| Trace (След) – при перемещении в области графика указателя мыши при нажатой левой кнопке в полях X-Value (значение X), Y-Value (значение Y), диалогового окна X-Y Trace(рис. 9) отображаются координаты точки, на которую указывает курсор. Если установлена опция Track Data Points (След точек данных), то курсор-крестик будет перемещаться вдоль графика функции и вы сможете считывать текущее значение аргумента x и соответствующее значение функции y = f (x). Координаты текущей точки можно скопировать в буфер при помощи кнопок Copy X (Копировать Х) Copy Y (Копировать Y). |
 Рис. 9. Диалоговое окно X-Y Trace
отображает координаты точки,
на которую указывает курсор
Рис. 9. Диалоговое окно X-Y Trace
отображает координаты точки,
на которую указывает курсор
| ||
 Рис. 10. Диалоговое окно Zoom
(Изменение масштаба)
Рис. 10. Диалоговое окно Zoom
(Изменение масштаба)
| Zoom (Изменение масштаба) – при помощи этой команды можно увеличить фрагмент графика, предварительно выделив его протаскиванием мышки с нажатой левой клавишей. После отпускания клавиши координаты углов выделенной области будут отображены в полях окна X-Y Zoom(рис. 10). При помощи кнопки Zoom (Масштаб +) фрагмент можно увеличить, при помощи кнопки Unzoom (Масштаб -) отменить выделение фрагмента, а при помощи кнопки Full View (Обзор) – восстановить первоначальный вид графика. Если вы увеличили фрагмент графика, то при щечке на кнопке OK в документе будет отображаться только этот фрагмент. | ||

