


Рассмотрим построение линейной регрессионной модели по выборочным данным следующего примера.
Пример. В табл. 2.1 приведены данные по 45 предприятиям по статистической связи между стоимостью основных фондов (fonds, млн. денежных единиц) и средней выработкой на 1 работника (product, тыс. денежных единиц); z – вспомогательный признак: z = 1 – федеральное подчинение, z = 2 – муниципальное.
Таблица 2.1
| fonds | product | z | fonds | product | z | fonds | product | z |
| 6,5 | 18,3 | 9,3 | 17,2 | 10,4 | 21,4 | |||
| 10,3 | 31,1 | 5,7 | 19,0 | 10,2 | 23,5 | |||
| 7,7 | 27,0 | 12,9 | 24,8 | 18,0 | 31,1 | |||
| 15,8 | 37,9 | 5,1 | 21,5 | 13,8 | 43,2 | |||
| 7,4 | 20,3 | 3,8 | 14,5 | 6,0 | 19,5 | |||
| 14,3 | 32,4 | 17,1 | 33,7 | 11,9 | 42,1 | |||
| 15,4 | 31,2 | 8,2 | 19,3 | 9,4 | 18,1 | |||
| 21,1 | 39,7 | 8,1 | 23,9 | 13,7 | 31,6 | |||
| 22,1 | 46,6 | 11,7 | 28,0 | 12,0 | 21,3 | |||
| 12,0 | 33,1 | 13,0 | 30,9 | 11,6 | 26,5 | |||
| 9,5 | 26,9 | 15,3 | 27,2 | 9,1 | 31,6 | |||
| 8,1 | 24,0 | 13,5 | 29,9 | 6,6 | 12,6 | |||
| 8,4 | 24,2 | 10,5 | 34,9 | 7,6 | 28,4 | |||
| 15,3 | 33,7 | 7,3 | 24,4 | 9,9 | 22,4 | |||
| 4,3 | 18,5 | 13,8 | 37,4 | 14,7 | 27,7 |
Предварительно построим диаграмму рассеяния, чтобы убедиться, что предположение линейности регрессионной зависимости не лишено смысла. Для этого в меню Graphs выберем команду Scatter plots. В полученном окне нажмем кнопку Variables., и установим зависимые данные – X: fonds, Y: product и опции графика – Graphs Type: Regular, Fit (подбор): Linear.
Наблюдаем диаграмму рассеяния с подобранной прямой регрессии, параметры которой отражены в ее заголовке. Это означает, что уравнение линейной регрессии имеет вид  .
.

Рис. 2.1. Диаграмма рассеяния
Чтобы получить обратную зависимость, в окне задания опций следует поменять местами переменные X и Y, то есть переменной X назначить колонку products, а переменной Y – fonds. В этом случае уравнение регрессии задается уравнением  , а прямая имеет вид, представленный на рис. 2.2.
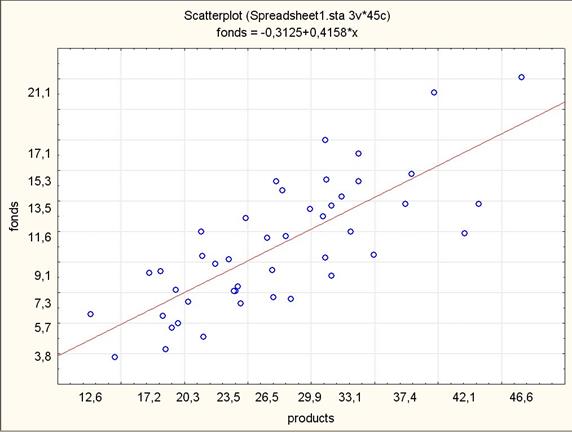
Рис 2.2. Обратная диаграмма рассеяния
По полученным графикам делаем вывод, что имеет смысл проводить регрессионный анализ по имеющимся исходным данным.
Будем работать в модуле Multiple Regression (множественная регрессия); меню Statistics – Multiple Regression. В качестве зависимой переменной выберем колонку fonds, в качестве независимой – колонку products, во вкладке Advanced установим опцию Input file (входной файл): Raw Data (необработанные данные).
Нажав кнопку OK, получаем основные результаты анализа (рис. 2.3) коэффициент детерминации R 2: 0.597; гипотеза о нулевом значении наклона отклоняется с высоким уровнем значимости p = 0.000000 (т.е. p < 10-6).

Рис. 2.3. Окно результатов регрессионного анализа
Поясним значения характеристик:
Dependent – имя зависимой переменной (в примере – fonds);
Multiple R – множественный коэффициент корреляции;
F – значение критерия Фишера, F=63, 54427;
R? (R2) – множественный коэффициент детерминации;
df – количество степеней свободы F -критерия;
No. of cases – количество наблюдений;
adjusted R? (R2) – скорректированный коэффициент детерминации, определяемый по формуле  ;
;
p – критический уровень значимости модели;
Standard error of estimate – среднеквадратическая ошибка;
Intercept – оценка свободного члена модели регрессии;
Std. Error – стандартная ошибка оценки свободного члена модели регрессии;
t(43) = -0,2106 и p = 0,8342 – значения критерия и критического уровня значимости, используемые для проверки гипотезу о равенстве нулю свободного члена регрессии. В данном случае гипотеза должна быть принята, если уровень значимости равен 0,8342 или ниже.
На вкладке Quick нажмем кнопку Summary Regression Results и получим таблицу результатов (рис. 2.4).

Рис. 2.4. Таблица результатов регрессионного анализа
В заголовке полученной таблицы повторены результаты предыдущего окна; в столбцах приведены: В – значения оценок параметров модели регрессии  и
и  ; столбец St. Err. of B – параметры стандартных ошибок параметров модели регрессии, соответственно
  и
и  ; столбец t(43) – значение статистики Стьюдента (t- критерия) для проверки гипотезы о нулевом значении коэффициента (т.е.
  и
и  ); столбец p-level – минимальный уровень значимости отклонения этой гипотезы. В данном случае, поскольку значения p-level очень малы (меньше 10-4), гипотезы о нулевых значениях коэффициентов отклоняются с высокой значимостью. Итак, имеем регрессию:
product = 11.5 + 1.43 fonds,
соответствующие стандартные ошибки коэффициентов: 2.1 и 0.18; значение s = 5.01 (Std Error of estimate – ошибка прогноза выработки по фондам с помощью этой функции). Значение коэффициента детерминации R 2 = RI = 0.597 достаточно велико (доля R = 0.77 всей изменчивости объясняется вариацией фондов). Уравнение регрессии показывает, что увеличение основных фондов на 1 млн. денежных единиц приводит к увеличению выработки 1 работника в среднем на b1 = 1.43 тыс. денежных единиц.
Многочисленные дополнительные опции модуля регрессии позволяют, например, вычислить результаты описательной статистики (среднее значение и среднее квадратическое отклонение), а также коэффициент корреляции между данными. Для этого можно воспользоваться вкладкой Advanced, нажав на ней кнопку Descriptive Statistics и выбрав необходимые кнопки. Результат будет отображен в отдельном окне. Нажав на кнопку во вкладке Matrix, получим общее окно, приведенное на рис. 2.5.

Рис. 2.5. Описательная статистика и коэффициент корреляции

