


Графические возможности системы MATLAB были достаточно подробно рассмотрены во второй части настоящей главы. Далее будут относительно кратко, но достаточно содержательно описаны вопросы создания графиков функций, заданных в символьном виде.
Построить график функции одной переменной можно с использованием функции ezplot, обращение к которой имеет вид:
ezplot(func [, xmin, xmax])
где func – символьное выражение, задающее функцию одной переменной; xmin и xmax – границы отрезка, на котором требуется построить график функции, причем если эти границы не указываются (т.е. указан лишь один параметр при обращении к функции ezplot, то график будет построен на интервале  .
.
Построим график функции  (рис. 2.27.1):
>> syms x
>> ezplot(cos(x/2)+cos(5*x)/5)
Кривая на рис. 2.27.2 получена в результате выполнения команды
>> ezplot(cos(x/2)+cos(5*x)/5,[-15 15])
На рис. 2.27.3 приведен график разрывной функции  :
:
>> syms x
>> ezplot(x/(x^2-4))
Важной особенностью функции ezplot является возможность построения графика функции, заданной неявно (неявной функции). Для этого команда должна быть вызвана в формате
ezplot(func [, xmin, xmax, ymin, ymax])
где xmin и xmax – пределы изменения первого по алфавиту аргумента симметричной функции  ; ymin и ymax – тоже для второго аргумента.
На рис. 2.27.4 приведен график функции  после команды вида
>> ezplot('x^2/5+y^2/7-1')
а на рис. 2.27.5 приведен график той же функции, но при обращении
>> ezplot('x^2/5+y^2/7-1',[-2.5 2.5 -4 4])
Построим теперь график функции  (рис. 2.26.6):
>> syms x y
>> ezplot(x^3-y^4)
>> ezplot(x^4-y^6)
Функция ezplot позволяет также отображать параметрические функции. Для этого используется следующий синтаксис вызова:
ezplot(X, Y [, tmin, tmax])
где X и Y – символьные выражения, задающие правые части уравнений  и
и  ; [tmin, tmax] – границы изменения параметра
  (если они не указаны, то принимается, что
  ).
).
Построим, например, график параметрически заданной функции вида  ,
,  ,
,  . Имеем (рис. 2.27.7):
>> ezplot('cos(t)+t*sin(t)','sin(t)-t*cos(t)',[0 4*pi])
Для построения графика функции в полярных координатах используется команда
ezpolar(func, [, alpha, beta])
где func – символьное выражение, задающее правую часть заданной в полярной системе координат функции  ; [alpha, beta] – интервал изменения переменной
  (по умолчанию принимается
  ).
).
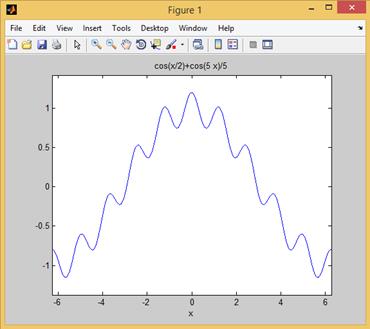
Рис. 2.27.1. График функции .
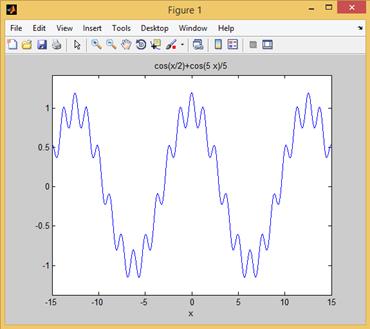
Рис. 2.27.2. График функции при  .
.
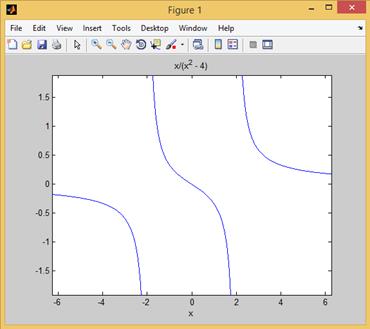
Рис. 2.27.3. График функции  .
.
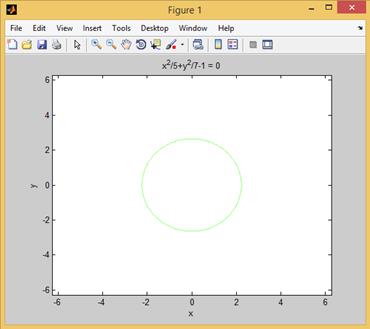
Рис. 2.27.4. График функции .
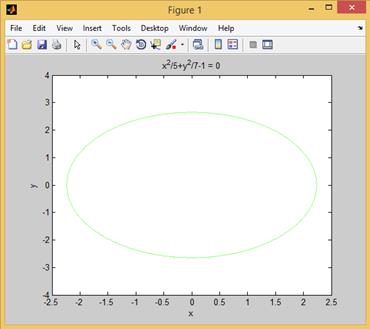
Рис. 2.27.5. График функции .
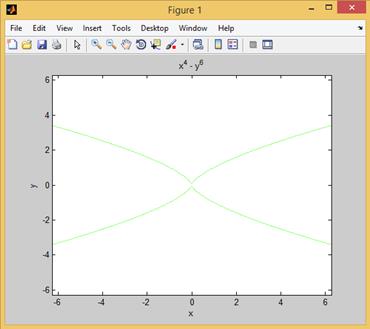
Рис. 2.26.6. График функции  .
.
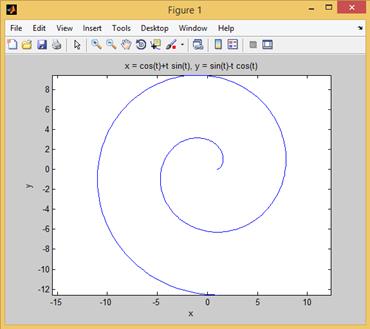
Рис. 2.27.7. График функции ,  .
.
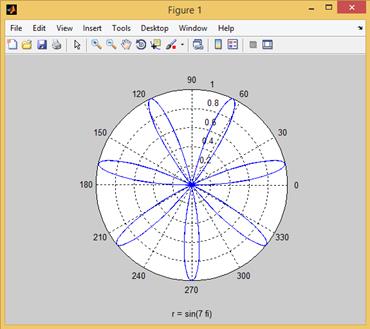
Рис. 2.27.8. График функции  .
.
Построим, например, график функции (рис. 2.27.8):
>> ezpolar('sin(7*fi)')
Построим график функции  (рис. 2.27.9):
>> syms t
>> ezpolar(1+sin(t))

