


запустимо макрос онв«“орг варт (або натиснемо на Ђшви≠дку клав≥шуї Ctrl+Shift+E). ¬ результат≥ виконанн€ макроса утворитьс€ новий листок Ђ вартї з квартальною груповою ста≠тистикою. јктивною кл≥тинкою на цьому листку в цей момент буде кл≥тинка Ђ“оварна групаї заголовку.
«апустимо макрос ¬с≥ вартћ≥с (через меню або за допомо≠гою комб≥нац≥њ клав≥ш Ctrl+Shift+D). ¬ результат≥ буде створено листок Ђћ≥сї з м≥с€чною груповою статистикою.
≈тап 3. јктив≥зуЇмо листок Ђ“оварї ≥ кл≥тинку Ђ–≥кї на заго≠ловку таблиц≥ з даними виб≥ркового обстеженн€ попиту. «апус≠тимо макрос ѕ≥дс“ов (через меню або клав≥шами Ctrl+Shift+F). ¬ результат≥ буде створено новий листок Ђ“—ортї з п≥дсумкови≠ми даними виб≥ркового обстеженн€. јктивною знову буде кл≥ти≠нка Ђ–≥кї на заголовку таблиц≥.
«а допомогою макроса оп¬с≥ѕ≥дс {Ctrl+Shift+C) п≥дсумки доповнюютьс€ п≥дсумковою ≥нформац≥Їю. «нову активною стане кл≥тинка Ђ–≥кї на заголовку таблиц≥.
≈тап 4. ћакрос ‘ормѕ≥дс (Ctrl+Shift+G) в≥дф≥льтровуЇ п≥д≠сумки ≥ переписуЇ на новий листок Ђ“ѕ≥дсї п≥дсумков≥ значенн€ (усуваючи формули). ћакрос ѕ≥дс–ез (Ctrl+Shift+H) утворюЇ листок Ђ“–езї, на €кий переписуЇ в≥дф≥льтрован≥ значенн€, ≥ усу≠ваЇ зайвий тепер стовпчик јѕ.
“аким чином, основн≥ рутинн≥ процедури задач≥ оц≥нки попи≠ту на товари ефективно автоматизуютьс€ за допомогою шести основних макрос≥в, наведених в таблиц≥ IIonnT.XLS. Ќа листку Ђ≤нстрї ц≥Їњ таблиц≥ наведена коротка п≥дказка про призначенн€ описаних макрос≥в.
ћетодичн≥ вказ≥вки до завданн€ 2
¬ пер≥од становленн€ ринковоњ економ≥ки важливою умовою усп≥шного функц≥онуванн€ в≥тчизн€ного п≥дприЇмства Ї його пе-
10*
реор≥Їнтац≥€ на засади маркетингу. ÷е означаЇ, що п≥дприЇмство переор≥ЇнтовуЇтьс€ на проектуванн€, виробництво ≥ збут товар≥в, €к≥ задовольн€ють попит споживач≥в ≥ в≥дпов≥дають њхн≥м певним запитам.
ѕрийн€тт€ управл≥нських р≥шень, в тому числ≥ маркетингових р≥шень, базуЇтьс€ на повн≥й ≥ достов≥рн≥й ≥нформац≥њ про ринок, попит на товари, уподобанн€ споживач≥в, ринков≥ ц≥ни, д≥њ кон≠курент≥в, про показники д≥€льност≥ об'Їкта управл≥нн€. «начн≥ обс€ги ≥нформац≥њ, потреба оперативних розрахунк≥в, пошуку та наданн€ маркетологам в≥дпов≥дноњ ≥нформац≥њ дл€ прийн€тт€ р≥≠шень зумовлюють необх≥дн≥сть використанн€ засоб≥в комп'ютер≠ноњ техн≥ки та ≥нформац≥йних технолог≥й, в тому числ≥ автомати≠зованих робочих м≥сць (ј–ћ) спец≥ал≥ст≥в.
«а допомогою ј–ћ маркетолога розв'€зуютьс€ так≥ завданн€, €к вивченн€ реал≥зованого ≥ незадоволеного попиту, його прогно≠зуванн€, анал≥з ринку ≥ його кон'юнктури, визначенн€ м≥сткост≥ ≥ сегментац≥њ ринку.
”правл≥нн€ маркетингом починаЇтьс€, насамперед, з постано≠вки ц≥лей, €к≥ в основному впливають на виб≥р шл€х≥в розвитку маркетинговоњ д≥€льност≥, зм≥ст плану маркетингу й на орган≥за≠ц≥ю його виконанн€. Ќа основ≥ вироблених ц≥лей зд≥йснюЇтьс€ прогнозуванн€ умов ≥ результат≥в розвитку маркетинговоњ д≥€ль≠ност≥ п≥дприЇмства. ѕрогноз Ч це наукове передбаченн€ ймов≥р≠них шл€х≥в розвитку соц≥ально-економ≥чних €вищ ≥ процес≥в дл€ б≥льш-менш в≥ддаленого майбутнього. ѕрогнозна ≥нформац≥€ стаЇ науковою базою планових вир≥шень.
|
|
|
–озробка наукових прогноз≥в попиту на взутт€ базуЇтьс€ на застосуванн≥ методу вивченн€ великих к≥бернетичних систем. ќсобливе значенн€ моделюванн€ дл€ досл≥дженн€ великих сис≠тем пов'€зано з обмеженн€м експериментуванн€ над ними. ¬ цих умовах приходитьс€ зд≥йснювати досл≥ди з моделлю системи, €ка повинна бути прост≥шою досл≥джуваноњ системи у вс≥х своњх ас≠пектах.
ћодель Ч це в≥дображенн€ певноњ системи, ≥з допомогою €коњ в≥дтворюютьс€ њњ суттЇв≥ ознаки. ≤ншими словами, модель Ч це спрощене поданн€ де€коњ системи, €ке б≥льш доступне й зручне дл€ вивченн€. ћ≥н€ючи характеристики системи ≥ до≠сл≥джуючи њњ повед≥нку, модель дозвол€Ї експериментувати ≥з системою.
¬ажливе м≥сце в систем≥ економ≥ко-математичних моделей займають модел≥ прогнозуванн€ кооперативноњ торг≥вл≥ €к га≠луз≥. —еред цих моделей особливу роль в≥д≥грають модел≥ про-
гнозуванн€ попиту, значенн€ €ких визначаютьс€ тим, що роз≠рахунки, отриман≥ на њх основ≥, Ї основою визначенн€ перспек≠тивних план≥в, що в≥д ступен€ точност≥ прогноз≥в попиту зале≠жить обгрунтован≥сть замовлень торг≥вл≥ на виробництво ≥ постановку товар≥в народного споживанн€. ѕрогнозуванн€ по≠питу зд≥йснюЇтьс€ за допомогою таких метод≥в, €к корел€ц≥й-но-регрес≥йний анал≥з, трендових ≥ авторегресивних моделей, коеф≥ц≥Їнта еластичност≥.
≈коном≥ко-математична модель попиту базуЇтьс€ на застосу≠ванн≥ корел€ц≥йно-регрес≥йного анал≥зу, €ка враховуЇ вплив фак≠тор≥в, формуючих попит. ¬ ц≥й модел≥ попит виражаЇтьс€ €к фу≠нкц≥€ багатьох зм≥нних:
де у Ч залежна зм≥нна, €ка виражаЇ величину попиту;
х1,х2,...,хп Ч незалежн≥ зм≥нн≥, €к≥ вв≥дпов≥дають факторам попиту.
орел€ц≥йно-регрес≥йний анал≥з складаЇтьс€ з таких основних етап≥в:
1) побудова системи фактор≥в, що найсуттЇв≥ше впливають на результативну ознаку;
2) розробка модел≥, €ка в≥дображаЇ загальний зм≥ст взаЇмо≠зв'€зк≥в, що вивчаютьс€, та к≥льк≥сна оц≥нка њњ параметр≥в;
3) перев≥рка €кост≥ модел≥;
4) оц≥нка впливу окремих фактор≥в.
Ќа першому етап≥ зд≥йснюЇтьс€ в≥дб≥р фактор≥в, що суттЇво впливають на результативну зм≥нну. ƒл€ отриманн€ над≥йних оц≥нок у модель не сл≥д включати надто багато фактор≥в. њхн€ к≥≠льк≥сть не повинна бути б≥льшою одн≥Їњ третини обс€гу даних, що анал≥зуютьс€. ѕри використанн≥ персональних комп'ютер≥в в≥дб≥р фактор≥в зд≥йснюЇтьс€ безпосередньо в процес≥ створенн€ модел≥ методом посл≥довноњ регрес≥њ. —уть цього методу пол€гаЇ у посл≥довному включенн≥ додаткових фактор≥в у модель та оц≥≠нц≥ впливу доданого фактора. ¬икористовуЇтьс€ також п≥дх≥д, за €кого на фактори, що включаютьс€ у попередн≥й склад модел≥, не накладаЇтьс€ особливих обмежень ≥ лише на наступних стад≥€х проводитьс€ њхнЇ оц≥нюванн€ та в≥дб≥р.
¬≥дб≥р фактор≥в, тобто встановленн€ т≥сноти зв'€зку, €ка ≥снуЇ м≥ж показниками, наприклад, попитом ≥ грошовими доходами, зд≥йснюють на основ≥ обчисленн€ пр€мол≥н≥йного коеф≥ц≥Їнта корел€ц≥њ:

|

|
 ÷€ формула маЇ розпод≥л —тьюдента з к=п-2 ступен€ми сво≠боди. ƒл€ заданоњ ймов≥рност≥ р ≥ ступен≥в свободи к знаходитьс€
табличне значенн€ t рк Ч статистики. якщо t>tpk, то ≥з зада≠ною над≥йн≥стю р приймаЇтьс€ г≥потеза Ќх про на€вн≥сть коре≠л€ц≥йного зв'€зку м≥ж випадковими величинами х тау (м≥ж попи≠том ≥ грошовими доходами).
якщо t < t к, то приймаЇтьс€ г≥потеза Ќ0. ¬ цьому випадку
|
|
|
можна говорити, що з над≥йн≥стю р корел€ц≥йний зв'€зок м≥ж ви≠падковими величинами х, у в≥дсутн≥й.
ѕарний коеф≥ц≥Їнт корел€ц≥њ характеризуЇ зв'€зок м≥ж залеж≠ною зм≥нною ≥ одним ≥з фактор≥в (наприклад, м≥ж попитом ≥ до≠ходами, без урахуванн€ ц≥н ≥ товарообороту з 1 м2 складськоњ площ≥). ¬ цьому випадку необх≥дно визначити частинний коеф≥≠ц≥Їнт корел€ц≥њ.
„астинний коеф≥ц≥Їнт корел€ц≥њ характеризуЇ корел€ц≥йний зв'€зок м≥ж залежною зм≥нною ≥ одним ≥з фактор≥в при виклю-

|


–озрахунок л≥н≥йного коеф≥ц≥Їнту корел€ц≥њ та оц≥нки параме≠тр≥в парноњ л≥н≥йноњ регрес≥њ можна зд≥йснювати двома методами, застосувавши програмн≥ засоби MS Excel та ѕѕѕ Ђј–ћ мене≠джера торговельного п≥дприЇмстваї.
ѕерший метод пол€гаЇ у можливост≥ MS Excel тиражувати формули з абсолютними, в≥дносними ≥ зм≥шаними адресами.
ƒл€ розрахунку коеф≥ц≥Їнта корел€ц≥њ побудуйте таблицю на≠ступного виду (табл. 40).
ѕобудувавши таблицю, виконайте наступне: '
1. ¬нес≥ть заголовки таблиц≥, стовпчик≥в, введ≥ть дан≥ ≥ в≥дфо≠рматуйте таблицю.
2. ¬ кл≥тинки ¬23, ¬24 занес≥ть формули дл€ визначенн€ се≠редн≥х значень фактора (доход≥в на душу населенн€) ≥ показника (реал≥зованого попиту, тобто товарооб≥гу взутт€), застосувавши статистичну функц≥ю AVERAGE (—–«Ќј„).
2.1. ƒл€ цього в кл≥тинки ¬23 ≥ ¬24 введ≥ть, в≥дпов≥дно, фор≠мули =AVERAGE (B2:B20), =AVERAGE (C2:C20).
2.2. ¬ кл≥тинку D2 введ≥ть формулу =¬2 Ч ¬$23, в кл≥тинку ≈2 Ч формулу =—2 Ч ¬$24,в кл≥тинку–2- формулу =D2 * ≈2, в кл≥тинку G2 Ч формулу =D2 * D2, в кл≥тинку Ќ Ч формулу = = ≈2 * ≈2.
2.3. —коп≥юйте ц≥ формули у решту кл≥тинок в≥дпов≥дних сто≠впчик≥в, р€дк≥в 3 Ч 20.
2.4. «астосуйте ≥нструмент автосумуванн€ ≥ розрахуйте в кл≥≠тинц≥ F21 суму добутку центрованих величин показника ≥ факто≠ра. —уми квадрат≥в центрованих величин розрахуйте в кл≥тинках G21 та Ќ21. –озрахуйте суми фактора ≥ показника ≥ њх в≥дхиленн€ в≥д середн≥х в кл≥тинках ¬21, —21, D21, ≈21.
2.5. ¬ кл≥тинц≥ ¬25 розрахуйте л≥н≥йний коеф≥ц≥Їнт корел€ц≥њ, використавши математичну функц≥ю SQRT ( ќ–≈Ќ№). ƒл€ цього внес≥ть в кл≥тинку ¬25 формулу =F21 / SQRT(G21*H21).
≤нший метод розрахунку л≥н≥йного коеф≥ц≥Їнта корел€ц≥њ по≠л€гаЇ у використанн≥ статистичноњ функц≥њ CORREL ( ќ––≈Ћ).

|

|
Ќадбудова Analysis ToolPak входить в стандартну ≥нстал€ц≥ю MS Office 97. якщо при ≥нстал€ц≥њ пакета вона була включена в робочий комплект, то при вибор≥ з меню операц≥њ Tools Ч > Add-Ins на екран≥ з'€вл€Їтьс€ в≥кно мон≥тора надбудов. ¬ ньому пере-числен≥ вс≥ за≥нстальован≥ на комп'ютер≥ надбудови пакету MS Excel. —еред них бачимо Analysis ToolPak та Solver. ожна з та≠ких надбудов може бути активною (п≥д'Їднаною) або неактивною (в≥д'Їднаною). ” в≥кн≥ мон≥тора надбудов активн≥ надбудови в≥д≠м≥чен≥ галочками (п≥дн€тими прапорц€ми, chekbox on). Ѕудь-€ку з перел≥чених в ньому надбудов можна актив≥зувати, в≥дм≥тивши њњ галочкою.
3. ѕоставте табличний курсор на кл≥тинку ¬26. ќперац≥Їю Insert Ч > Function або ≥нструментом fx в≥дкрийте в≥кно констру≠ктора функц≥й ≥ вибер≥ть функц≥ю CORREL ( ќ––≈Ћ) з групи Statistical (—татистические).
3.1. ¬ перше поле введ≥ть блок даних фактора х (¬2:¬20), у друге поле занес≥ть дан≥ попиту (—2:—20).
3.2. Ќатисн≥ть на клав≥шу ќ (√отово) ≥ в активн≥й кл≥тинц≥ (¬26) отримаЇте значенн€ коеф≥ц≥Їнта корел€ц≥њ.
4.ƒл€ перев≥рки значимост≥ коеф≥ц≥Їнта корел€ц≥њ в кл≥тинку ¬27 занес≥ть формулу обчисленн€ розрахункового значенн€ t- статистики. ƒл€ знаходженн€ критичного ≥ак -розпод≥лу викорис≠тайте статистичну функц≥ю TINV (—“№ёƒ–ј—ѕ).
4.1. ѕоставте табличний курсор на кл≥тинку ¬28, де буде зна≠ходитись критичне значенн€ tak -розпод≥лу.
4.2. ¬иклич≥ть конструктор функц≥й ≥ вибер≥ть функц≥ю TINV з групи Statistical (—татистические).
4.3. ¬вед≥ть у перше поле р≥вень значимост≥ а = ≥-р (р Ч це дов≥рча ймов≥рн≥сть 0,95), в друге поле Ч число ступен≥в свободи (п - 2), тобто 17, ≥ натисн≥ть на клав≥шу ќ (√отово).
|
|
|
4.4. ¬ активн≥й кл≥тинц≥ (¬28) одержите критичне значенн€ tak -розпод≥лу. ѕор≥вн€йте його з ^-розрахунковим (кл≥тинка ¬28) ≥ зроб≥ть в≥дпов≥дн≥ висновки.
ƒл€ оц≥нки параметр≥в парноњ л≥н≥йноњ регрес≥њ побудуйте на≠ступну таблицю.
ѕерший метод оц≥нки параметр≥в регрес≥њ базуЇтьс€ на зда≠тност≥ MS Excel тиражуват≥ формули з абсолютними, в≥днос≠ними ≥ зм≥шаними адресами. ƒл€ оц≥нки параметр≥в виконайте так≥ д≥њ:
1. ¬ кл≥тинки D2 ≥ ≈2 введ≥ть формули =¬2 * —2 ≥ =¬2 * ¬2 та розмножте њх на блоки D3:D20, E3:E20.
“аблиц€ 41
–ќ«–ј’”Ќќ ѕј–јћ≈“–≤¬ “ј —“ј“»—“» » ѕј–Ќќѓ Ћ≤Ќ≤…Ќќѓ –≈√–≈—≤ѓ


|
ѕозначенн€:
х Ч товарооб≥г –—— на душу населенн€, грн;
у Ч товарооб≥г взутт€, грн;
N Ч номер п≥дприЇмства.
|
и346


|

|

|
якщо визначник матриц≥, елементами €коњ Ї коеф≥ц≥Їнти при нев≥домих ао, а\,..., ат, в≥дм≥нний в≥д нул€, то система нормаль≠них р≥вн€нь маЇ Їдиний розв'€зок.
якщо визначник матриц≥ X в≥дм≥нний в≥д нул€, то ≥снуЇ мат≠риц€, обернена до X ≥ система нормальних р≥вн€нь маЇ Їдиний розв'€зок. ƒомноживши матричне р≥вн€нн€ зл≥ва на обернену ма≠трицю, одержимо вектор оц≥нок параметр≥в а.

|
ƒл€ двофакторноњ л≥н≥йноњ модел≥ у = b + mlxl +m2x2 парамет≠ри т/ ≥ п≥2 визначаютьс€ за формулами:

|

|

|

|
6. ¬ результат≥ на екран≥ в≥дображаЇтьс€ вид≥лений блок з≥ значенн€м коеф≥ц≥Їнта при фактор≥ т2 л≥н≥йноњ модел≥ в його по≠чатков≥й кл≥тинц≥; в р€дку формули в≥дображаЇтьс€ формула з функц≥Їю LINEST та њњ параметрами. Ќатисн≥ть на клав≥шу F2 дл€ переходу курсора в р€док формули; при цьому режим роботи зм≥нюЇтьс€ на Edit (режим роботи пакету в≥дображаЇтьс€ на па≠нел≥ статусу).
7. Ќатисн≥ть на комб≥нац≥ю клав≥ш Ctrl+Shift+Enter. ¬ ре≠зультат≥ створюЇтьс€ масивно-значна функц≥€ (тобто функц≥€, ре≠зультатом €коњ Ї мјсив). ќбчислений функц≥Їю масив значень заноситьс€ у вид≥лений блок.
ƒл€ в≥дображенн€ всього масиву вид≥лений блок повинен ма≠ти п'€ть р€дк≥в ≥ п+\ стовпчик, де п Ч к≥льк≥сть фактор≥в. «вер≠н≥ть увагу на те, що функц≥€ LINEST (Ћ»Ќ≈…Ќ) повертаЇ коеф≥≠ц≥Їнти регрес≥њ у посл≥довност≥, зворотн≥й щодо њх посл≥довност≥ в модел≥.
8. ƒл€ визначенн€ розрахункових ≥ прогнозних значень попи≠
ту кл≥тинкам, в €ких знаходитьс€ регрес≥йна статистика, надайте
њм так≥ ≥мена:
| ≤м'€ | Ѕлок кл≥тинок |
| т_2 | F2 |
| т_1 | G2 |
| ь_о | Ќ2 |
| —туп≥нь свободи | G5 |
9. ” кл≥тинку J2 введ≥ть формулу = т_2 * ѕлоща + т_1 * ƒо≠х≥д + №_0. ÷ю формулу скоп≥юйте на блок кл≥тинок J3:J20, в €ких будуть обчислюватис€ розрахунков≥ значенн€ попиту.
10. ƒл€ перев≥рки значимост≥ коеф≥ц≥Їнт≥в регрес≥њ розгл€ньте г≥потезу про те, що н≥ дох≥д на душу населенн€, н≥ розм≥р торго≠вельноњ площ≥ залу не впливають на обс€ги попиту на задану групу товар≥в, €ка називаЇтьс€ нуль-г≥потезою. ƒл€ њњ перев≥рки використайте розрахован≥ функц≥Їю LINEST стандартн≥ похибки.
11. ƒ≥ленн€ коеф≥ц≥Їнт≥в регрес≥њ на њх стандартн≥ похибки даЇ значенн€ стандартизованих (нормованих) зм≥нних t (^-статис≠тики). —тандартизован≥ зм≥нн≥ показують в≥дстан≥ в≥д нул€ в≥дпо≠в≥дних коеф≥ц≥Їнт≥в регрес≥њ у частках стандартних помилок. ƒл€ обчисленн€ значень стандартизованих зм≥нних у кл≥тинку F13 введ≥ть формулу =F2/F3 ≥ розмножте на блок G13:H13.
12. ƒл€ визначенн€ значимост≥ стандартного в≥дхиленн€ ско-рикористайтес€ функц≥Їю TINV (—“№ёƒ–ј—ѕ). ¬она визначаЇ ймов≥рн≥сть отриманн€ значенн€ стандартизованоњ зм≥нноњ за умови, що д≥йсне значенн€ в≥дпов≥дного коеф≥ц≥Їнта регрес≥њ до≠р≥внюЇ нулю. ƒл€ кожного коеф≥ц≥Їнта та в≥льного члена регрес≥њ в кл≥тинку F14 введ≥ть формулу
|
|
|
=TINV(ABS(F13); —тупсвободи)
≥ розмножте њњ на блок кл≥тинок G14:H14. ‘ункц≥€ ABS вико≠ристовуЇтьс€ у ц≥й формул≥ дл€ того, щоб значенн€ першого па≠раметра функц≥њ TINV було нев≥д'Їмним.
ћетодичн≥ вказ≥вки до завданн€ «
ѕобудова багатофакторних корел€ц≥йно-регрес≥йних моделей вимагаЇ детальноњ ≥нформац≥њ про фактори, €к≥ впливають на ре≠зультатну зм≥нну (в нашому приклад≥ це попит). ќск≥льки торго≠вельна статистика такоњ ≥нформац≥њ не надаЇ, тому на њњ баз≥ по≠тр≥бно побудувати трендов≥ модел≥, €к≥ дадуть змогу екстра≠полювати величину попиту попередн≥х пер≥од≥в (1, 2,..., п) на майбутн≥ (п + 1, п + 2,...). ÷ей метод даЇ задов≥льн≥ значенн€ ли≠ше в раз≥ короткочасного прогнозуванн€ (на квартал, р≥к), оск≥ль≠ки анал≥зуЇ виключно тенденц≥ю зм≥ни попиту в час≥ ≥ не врахо≠вуЇ впливу на нього жодних чинник≥в.
≈кстраполюючи динам≥чний р€д попиту т≥Їю або ≥ншою фун≠кц≥Їю ƒі), можна представити його у вигл€д≥ суми двох складо≠вих: тренду {у = f{t)) ≥ випадковоњ величини Ї,, €ка акумулюЇ вплив р≥зних фактор≥в: y-f{t) + zt.

|
ƒинам≥ку попиту звичайно моделюють такими математични≠ми залежност€ми:


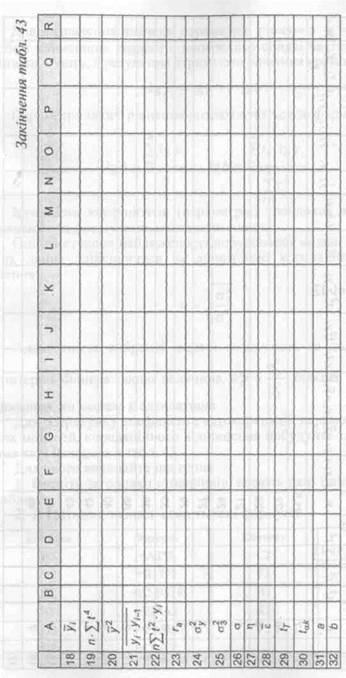

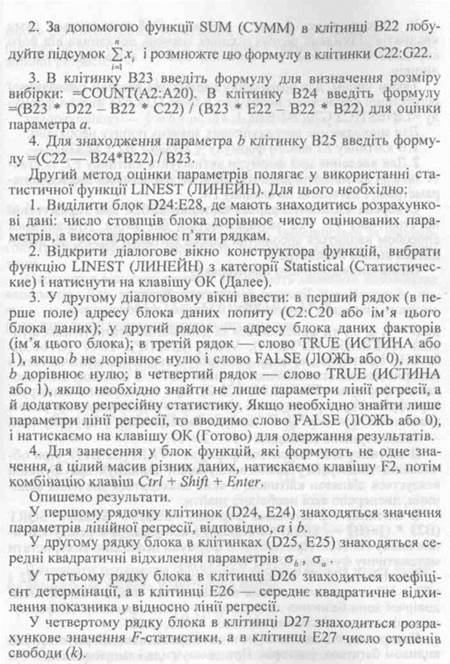
 в кл≥тинку ¬27 Ч формулу =SQRT(B25/B24). ѕопередньо в кл≥тин≠ц≥ ¬24 за формулою =H17/(G18-1) обчисл≥ть а2у.
11. ѕерев≥рку значимост≥ модел≥ г\ зд≥йсн≥ть пор≥вн€нн€м роз≠рахункового ≥ табличного (критичного) значенн€ /-статистики, €к≥ обчислюютьс€ в кл≥тинках ¬29 ≥ ¬«ќ в≥дпов≥дно. ƒл€ знахо≠дженн€ критичного значенн€ tak скористайтес€ вбудованою ста≠тистичною функц≥Їю TINV.
12. ¬ кл≥тинц≥ ¬28 обчисл≥ть в≥дносну помилку апроксимац≥њ Ї, занес≥ть дл€ цього в кл≥тинку формулу =1/G18*Q17*100.
13. ¬ кл≥тинки блоку S2:T16 занес≥ть формули дл€ обчисленн€ значень нижньоњ ≥ верхньоњ меж≥ дов≥рчоњ зони емп≥ричних даних ≥ прогнозу попиту, методика розрахунку €ких була описана вище.
14. ¬иход€чи з обчислених значень попиту, побудуйте граф≥к трен-довоњ модел≥, на €кому в≥добраз≥ть також емп≥ричн≥ значенн€ попиту.

|
| –ис. 37. Ћ≥н≥йна д≥аграма динам≥ки попиту на цукор |
Ќа рис.37 наведено л≥н≥йну д≥аграму емп≥ричних та теоретич≠них значень попиту на цукор, розрахованих за л≥н≥йною моделлю на баз≥ торговельноњ статистики за 15 минулих рок≥в. Ќа рис.38 наведено аналог≥чну л≥н≥йну д≥аграму, побудовану на баз≥ емп≥≠ричних та теоретичних значень попиту на цукор за минул≥ роки та прогнозних значень на наступн≥ 3 роки.
ƒл€ побудови цих д≥аграм рекомендуЇтьс€ така посл≥дов≠н≥сть д≥й:
1. ¬ид≥л≥ть блок кл≥тинок таблиц≥ з даними про фактичну ≥ розрахункову реал≥зац≥ю цукру ≥ застосуйте операц≥ю Insert Ч> Chart, €ка викликаЇ конструктор д≥аграм (його можна також ви≠кликати ≥нструментом Chart Wizard).
2. ” першому д≥алоговому в≥кн≥ конструктора д≥аграм (Step 1 of 4) вибер≥ть один ≥з запропонованих класичних тип≥в д≥аграми (Standard Types) або д≥аграму нестандартного типу (Custom Types). ƒл€ ≥люстрац≥њ розв'€зку даноњ задач≥ вибер≥ть плоску л≥н≥йну д≥≠аграму (Lines).
3. ” прав≥й половин≥ форми в≥дображаютьс€ можлив≥ вар≥анти д≥аграми вибраного типу. “ут доц≥льно залишити встановлений за замовчуванн€м тип л≥н≥йноњ д≥аграми з маркерами.

|
–ис. 38. Ћ≥н≥йна д≥аграма прогнозу попиту на цукор
4. ” другому д≥алоговому в≥кн≥ конструктора д≥аграм (Step 2 of 4) Ї дв≥ стор≥нки параметр≥в: Data Range (ƒипазон данных) ≥ Series (–€д). ÷≥ параметри задаютьс€ автоматично вибором обла≠ст≥ даних та типу граф≥ка, однак, користувач може зм≥нити њх, оск≥льки стандартний виб≥р параметр≥в годитьс€ далеко не дл€ вс≥х випадк≥в ≥, можливо, не Ї найкращим.
12ћ6
 ѕоле Date Range визначаЇ адресу област≥ даних граф≥ку. ѕе≠ремикач Series in (–€ды в) визначаЇ ор≥Їнтац≥ю р€д≥в даних: дан≥ розташовуютьс€ в р€дках (Rows, —троках) чи стовпчиках (Columns, —толбцах). ” пол≥ Data Range задаютьс€ адреси р€д≥в даних, кожен з €ких в≥дпов≥даЇ л≥н≥њ л≥н≥йноњ д≥аграми.
Ќа стор≥нц≥ Series (–€д) за допомогою клав≥ш Add (ƒобавить) ≥ Remove (”далить) можна додати нов≥ та знищити ≥снуюч≥ р€ди даних. ѕ≥сл€ вибору в пол≥ Series одного з р€д≥в стають доступ≠ними пол€ Name та Values, в €ких можна задати параметри цього р€ду. ¬ пол≥ Values розташовуЇтьс€ адреса блоку даних цього р€≠ду, а в пол≥ Name Ч назва р€ду або адреса кл≥тинки з ц≥Їю на≠звою.
ѕоле Category (X) axis labels (ѕодписи оси X) призначене дл€ адреси блоку, в €кому знаход€тьс€ м≥тки горизонтальноњ ос≥ (на≠приклад, роки чи дати). «а замовчуванн€м це поле пусте, а м≥тка≠ми ос≥ X служать њх номери.
5. ” третьому д≥алоговому в≥кн≥ конструктора д≥аграм (step «
of 4) розташовано 6 стор≥нок з параметрами зовн≥шнього вигл€ду
д≥аграми: Titles, Axes, Gridlines, Legend, Data Labels, Data Table.
ќпишемо де€к≥ важлив≥ параметри д≥аграми.
|
|
|
ƒ≥аграма за замовчуванн€м ≥люструЇтьс€ легендою Ч пр€мо≠кутною рамкою з назвами р€д≥в, €ка розташовуЇтьс€ на пол€х д≥≠аграми. ѕараметри легенди з≥бран≥ на стор≥нц≥ Legend (Ћегенда): прапорець Show Legend (ƒобавить Ћегенду) визначаЇ, чи буде ле≠генда в≥дображатис€ на д≥аграм≥, перемикач Placement (–азмеще≠ние) визначаЇ, на €кому з пол≥в д≥аграми буде в≥дображатис€ ле≠генда: Bottom Ч нижньому, “ор Ч верхньому, Right Ч правому, Left Ч л≥вому. ѕоложенн€ перемикача Corner означаЇ, що леген≠да буде в≥дображатис€ в правому верхньому кутку д≥аграми.
Ќа д≥аграм≥ можна розташувати заголовки (за замовчуванн€м њх немаЇ). ѕараметри заголовк≥в д≥аграми з≥бран≥ на стор≥нц≥ Titles («аголовки). ѕоле Chart Title (Ќазвание диаграммы) визна≠чаЇ назву д≥аграми, поле Category (X) axis Ч назву ос≥ X, поле Value (Y) axis Ч назву ос≥ Y.
6. Ќа останньому, четвертому кроц≥ конструктора д≥аграм (Step 4 of 4) вибер≥ть один з двох можливих способ≥в розташу≠ванн€ д≥аграми: на окремому листку (As new Sheet, ѕоместить ди≠аграмму на отдельном листе) або на робочому листкуу вигл€д≥ зовн≥шнього об'Їкта (As object in, ѕоместить диаграмму на лис≠те).
7. ƒл€ завершенн€ побудови д≥аграми в останньому в≥кн≥ на≠тисн≥ть на клав≥шу Finish (√отово).
8. ѕри побудов≥ д≥аграми на робочому листку таблиц≥ система MS Excel сама вибираЇ розташуванн€ та розм≥ри в≥кна д≥аграми. ќск≥льки д≥аграма створюЇтьс€ €к зовн≥шн≥й об'Їкт, то розташу≠ванн€, розм≥ри та ≥нш≥ параметри цього об'Їкта можна зм≥нити стандартними засобами Windows.
9. ƒл€ зм≥ни параметр≥в побудованоњ д≥аграми можна скорис≠татис€ операц≥€ми з меню Chart, €ке стаЇ доступним п≥сл€ актив≥≠зац≥њ зовн≥шнього об'Їкта або п≥сл€ актив≥зац≥њ стор≥нки д≥аграми.
ћетодичн≥ вказ≥вки до завдань 4 та 6
Ќалагодженн€ функц≥онуванн€ ј–ћа дл€ одночасноњ роботи багатьох користувач≥в (багатокористувацький або розпод≥лений режим) представл€Ї собою особливу задачу з област≥ системного програмного забезпеченн€, €ка призначена дл€ студент≥в, €к≥ спец≥ал≥зуютьс€ в област≥ ≥нформац≥йних систем.
ƒл€ цього рекомендуЇмо викликати MS Access з параметром Ч повним шл€хом до бази даних. Ќайпрост≥ше скоп≥ювати вказ≥≠вник (shortcut) на MS Access; в його пол≥ Target (командн≥й стр≥≠чц≥) знаходитьс€ шл€х до головного програмного модул€ MS Access, наприклад, ЂC:\Msoff97\Office\Msaccess.exeї. —коп≥йова≠ний вказ≥вник сл≥д в≥дкоректувати, доповнивши командну стр≥ч≠ку шл€хом до бази даних, наприклад,
ЂC:\Msoff97\Office\Msaccess.exe C:\ARMMTP\ARMMTP97.MDBї.

