


Получение данных из внешнего файла.
1. File Name - Имя файла с данными.
2. Sample time - Шаг изменения выходного сигнала блока.
Данные в файле должны быть представлены в виде матрицы:


Матрица должна состоять, как минимум, из двух строк. Значения времени записаны в первой строке матрицы, а в остальных строках находятся значения сигналов, соответствующие данным моментам времени. Значения времени должны быть записаны в возрастающем порядке. Выходной сигнал блока содержит только значения сигналов, а значения времени в нем отсутствуют. Если шаг расчета текущей модели не совпадает с отсчетами времени в файле данных, то Simulink выполняет линейную интерполяцию данных.
Файл данных (mat -файл), из которого считываются значения, не является текстовым. Структура файла подробно описана в справочной системе MATLAB. Пользователям Simulink удобнее всего создавать mat -файл с помощью блока To File (библиотека Sinks).
Блок считывания данных из рабочего пространства From Workspace
Получение данных из рабочего пространства MATLAB.
- Data – Имя переменной (матрицы или структуры) содержащей данные.
- Sample time - Шаг изменения выходного сигнала блока.
- Interpolate data — Интерполяция данных для значений модельного времени не совпадающих со значениями в переменной Data.
4. Form output after final data value by – Вид выходного сигнала по окончании значений времени в переменной Data:
- Extrapolate – Линейная экстраполяция сигналов.
- SettingToZero – Нулевые значения сигналов.
- HoldingFinalValue – Выходные значения сигналов равны последним значениям.
- CyclicRepetition – Циклическое повторение значений сигналов. Данный вариант может использоваться, только если переменная Data имеет формат Structure without time.
ЛЕКЦИЯ №6
БЛОКИ ОТОБРАЖЕНИЯ И РЕГИСТРАЦИИ ПРОЦЕССОВ БАЗОВЫЕ И СПЕЦИАЛЬНЫЕ SINKS - ПРИЕМНИКИ СИГНАЛОВ
Осциллограф Scope
Назначение: Строит графики исследуемых сигналов в функции времени. Позволяет наблюдать за изменениями сигналов в процессе моделирования. Изображение блока и окно для просмотра графиков показаны на рис. 6.1.

Рис. 6.1 – Осциллограф Scope
Для того, чтобы открыть окно просмотра сигналов необходимо выполнить двойной щелчок левой клавишей “мыши” на изображении блока. Это можно сделать на любом этапе расчета (как до начала расчета, так и после него, а также во время расчета). В том случае, если на вход блока поступает векторный сигнал, то кривая для каждого элемента вектора строится отдельным цветом.
Настройка окна осциллографа выполняется с помощью панелей инструментов (рис.6.2).

 |
Рис. 6.2 – Панель инструментов блока Scope
Панель инструментов содержит 7 кнопок:
1- Zoom – увеличение масштаба по обеим осям.
2 - Zoom X-axis – увеличение масштаба по горизонтальной оси.
3 - Zoom Y-axis – увеличение масштаба по вертикальной оси.
4 – Find signals – автоматическая установка масштабов по обеим осям.
6 - Properties – доступ к окну настройки параметров.
7 - Print – печать содержимого окна осциллографа.
Изменение масштабов отображаемых графиков можно выполнять несколькими способами:
1. Нажать соответствующую кнопку ( ,
,  или
или  ) и щелкнуть один раз левой клавишей “мыши” в нужном месте графика. Произойдет 2,5 кратное увеличение масштаба.
2. Нажать соответствующую кнопку (, или ) и, нажав левую клавишу “мыши”, с помощью динамической рамки или отрезка указать область графика для увеличенного изображения.
3. Нажать на кнопку Properties. Откроется окно свойств графика, в котором с помощью параметров Y-min и Y-max можно указать предельные значения вертикальной оси.
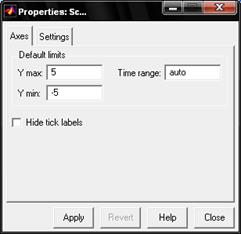
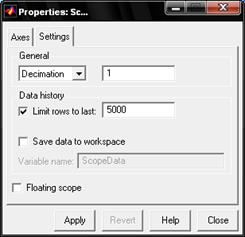
Рис. 6.3 – Окно свойств графика вкладка Axes и Settings
Параметры:
Параметры блока устанавливаются в окне Properties при нажатии на кнопку Properties панели инструментов. Окно параметров имеет две вкладки:
Axes – общие параметры и настройка масштаба.
Settings – параметры сохранения сигналов в рабочей области MATLAB.
На вкладке Axes можно
- указать предельные значения вертикальной оси, как уже отмечалось выше.
- имеется возможность установить параметр Time range – величина временного интервала для которого отображаются графики. Если время расчета модели превышает заданное параметром Time range, то вывод графика производится порциями, при этом интервал отображения каждой порции графика равен заданному значению Time range. По умолчанию в Time range установлено значение auto.
- установить флажок Hide tick labels, который означает скрытие осей и меток осей.
На вкладке Settings несколько областей.
В области General задаются параметры вывода графиков в окне. В раскрывающемся списке задается режим вывода расчетных точек на экран. При выборе Decimation кратность вывода устанавливается числом, задающим шаг выводимых расчетных точек. На рис. 6.4 и 6.5 показаны графики синусоидальных сигналов рассчитанных с фиксированным шагом 0.1 с. На рис. 6.4 в окне блока Scope выводится каждая расчетная точка (параметр Decimation равен 1). На рис. 6.5 показан вывод каждого второго значения (параметр Decimation равен 2). Маркерами на графиках отмечены расчетные точки.

| 
|
| Рис. 6.4 – Отображение синусоидального сигнала (Decimation = 1) | Рис. 6.5 – Отображение синусоидального сигнала (Decimation = 2) |
В том случае, если режим вывода расчетных точек задается как Sample time, то его числовое значение определяет интервал квантования при отображении сигнала. На рис. 6.6 показан график синусоидального сигнала, для случая, когда значение параметра Sample time равно 0.1.
Рис. 6.6 – Отображение синусоидального сигнала (Sample time = 0.1)
В области Data history задаются следующие параметры:
1. Limit rows to last – максимальное количество отображаемых расчетных точек графика. При превышении этого числа начальная часть графика обрезается. В том случае, если флажок параметра Limit data points to last не установлен, то Simulink автоматически увеличит значение этого параметра для отображения всех расчетных точек.
2. Save data to workspace – сохранение значений сигналов в рабочей области MATLAB.
3. Floating Scope – установка флажка переводит в режимосциллографа Floating Scope
Графопостроитель ХУ Graph
Назначение: Строит график одного сигнала в функции другого (график вида Y(X)) – статическую характеристику.
Параметры:
x-min – Минимальное значение сигнала по оси X.
x-max – Максимальное значение сигнала по оси X
y-min – Минимальное значение сигнала по оси Y.
y-max – Максимальное значение сигнала по оси Y
Sample time – шаг модельного времени.
Блок имеет два входа. Верхний вход предназначен для подачи сигнала, который является аргументом (X), нижний – для подачи значений функции (Y).
На рис. 6.7, в качестве примера использования графопостроителя, показано построение фазовой траектории колебательного звена.

Рис. 6.7 – Пример использования графопостроителя ХУ Graph
Графопостроитель можно использовать и для построения временных зависимостей. Для этого на первый вход следует подать временной сигнал с выхода блока Clock. Пример такого использования графопостроителя показан на рис. 6.8.

Рис. 6.8 – Пример использования блока ХУ Graph для отображения временных зависимостей
Цифровой дисплей Display
Назначение: Отображает значение сигнала в виде числа.
Параметры:
Format – формат отображения данных. Параметр Format может принимать следующие значения:
1. short – 5 значащих десятичных цифр.
2. long – 15 значащих десятичных цифр.
3. short_e – 5 значащих десятичных цифр и 3 символа степени десяти.
4. long_e – 15 значащих десятичных цифр и 3 символа степени десяти.
5. bank – " денежный " формат. Формат с фиксированной точкой и двумя десятичными цифрами в дробной части числа.
Decimation – кратность отображения входного сигнала.
При Decimation = 1 отображается каждое значение входного сигнала, при Decimation = 2 отображается каждое второе значение, при Decimation = 3 – каждое третье значение и т.д.
Sample time – шаг модельного времени. Определяет дискретность отображения данных.
Floating display (флажок)– перевод блока в “ свободный ” режим. В данном режиме входной порт блока отсутствует, а выбор сигнала для отображения выполняется щелчком левой клавиши “мыши” на соответствующей лини связи. В этом режиме для параметра расчета Signal storage reuse должно быть установлено значение off (вкладка Advanced в окне диалога Simulation parameters…).
На рис. 6.9 показано применение блока Display с использованием различных вариантов параметра Format.

Рис. 6.9 – Применение блока Display с использованием различных вариантов параметра Format
Блок Display может использоваться для отображения не только скалярных сигналов, но также векторных, матричных и комплексных. Рис. 6.10 иллюстрирует это. Если все отображаемые значения не могут поместиться в окне блока, в правом нижнем углу блока появляется символ  , указывающий на необходимость увеличить размеры блока (см. блок Display4 на рис. 6.10).

Рис. 6.10 – Применение блока Display для отображения векторных, матричных и комплексных сигналов

