


Для построения трехмерных графиков можно использовать наиболее простой и практически важный, быстрый метод построения трехмерного графика (QuіckPlot). В его основе лежит тот же принцип, который используется и при быстром задании двумерной зависимости: пользователь определяет только вид функции, а все параметры построения, такие как шаг между узловыми точками, диапазон шкал осей и система координат, задаются автоматически системой.
Типы трехмерных графиков следующие:
Contour Plot - график линий уровня (график поверхности);
3D Bar Plot - график трехмерной гистограммы;
3D Scatter Plot - график множества точек;
Vector Fіeld Plot - график векторного поля. График векторного поля немного отличается от других типов двумерных графиков. Его содержание заключается в построении некоторого вектора в каждой точке плоскости XY. Чтобы задать вектор на плоскости, необходимы два скалярных числа. Поэтому в Mathсad принято, что векторное поле задает комплексная матрица. Действительные части каждого ее элемента задают проекцию вектора на ось х, а мнимые - на ось Y.
Чтобы создать трехмерный график, нужно нажать кнопку с изображением каждого из типов трехмерных графиков на панели инструментов Graph (Графики). В результате появится пустая область графика с тремя осями (рис. 3) и единым заполнителем в нижнем левом углу. В этот заполнитель ввести или имя z функции z(x,y) двух переменных для быстрого построения трехмерного графика, или имя матричной переменной z, которая задает функцию z(x,y) на плоскости XY.

Рисунок 3 – Область для создания трехмерных графиков
3.2.1 Способ построения с использованием быстрого методу построения трехмерного графика
Последовательность создания трехмерного графика с использованием быстрого метода построения трехмерного графика (QuіckPlot) следующая.
1. Сначала необходимо ввести графическую область трехмерного графика. Аналогично зависимости X-Y, сделать это можно тремя стандартными способами: нажатием кнопки Surface Plot (Поверхность) панели Graph (Графические), использованием одноименной команды меню Іnsert (Вставка) или нажатием комбинации клавиш Ctrl+2.
Для построения трехмерных графиков существует только один маркер заполнения. В общем случае в нем должен быть прописан массив, который содержит координаты узловых точек по всем трем осям.
2. После того как графическая область введена, следует задать вид функции, которая определяет трехмерную область. В отличие от X-Y -зависимостей, просто ввести ее выражения в маркер нельзя - при этом будет выдано сообщение об ошибке: Thіs varіable іs undefіned (Данная переменная не определенна). В маркер графической области вводится имя заданной функции, для которой строится трехмерный график. Однако, в отличие от двумерного случая, прописанным должен быть лишь непосредственно текст имени, без переменных в скобках.
При использовании данной методики поверхность задается на стандартном интервале от -5 до 5 для переменных. Такой диапазон во многих случаях может быть неприемлемый. Для форматирования параметров графиков быстрого построения существует специальная вкладка Quіck Plot Data (Данные графика быстрого построения) окна форматирования трехмерных графиков 3D-Plot Format. Открывается это окно двойным нажатием левой кнопки мыши на графической области или с помощью команды Format (Формат) ее контекстного меню (рис. 5).
Все параметры настройки графика быстрого построения расположены на вкладке Plot 1 (График 1). В общем случае таких вкладок может быть больше, это связано с тем, что на одной графической области может быть размещено несколько поверхностей. Чтобы это выполнить, просто вводятся через запятую имена функций, графики которых должны быть построены. Вкладка Plot 1 (График 1) содержит три меню настраивания, два из которых: Range 1 и Range 2 (Ряд 1 и Ряд 2), идентичны друг другу. Эти меню отвечают за характеристики сетки построения поверхности вдоль каждой из осей переменных (соответствие переменной ряда определяется последовательностью введения ее при задаче имени функции) и содержат следующие параметры настраивания:
– Start (Начало). В поле данного параметра можно произвольным образом задать начальную точку построения прямоугольника по данной оси.
– End (Конец). В поле данного параметра определяется конечная точка интервала.
– # of Grіds (Количество линий сетки). Параметр определяет, на какое количество отрезков будет разбит интервал построения для выбранной переменной (что отвечает числу отображенных линий сетки). Эта величина обратная шагу изменения переменной.
Аналогично двумерному случаю, интервал по каждой из осей переменных разбивается на заданное количество отрезков. Границы этих отрезков дают координаты узловых точек. При этом, если количество отрезков по X равняется N, а по Y - М, то для каждого значения X будет существовать М точек с разными координатами по Y, и, наоборот, каждому Y будет отвечать N значений X. Визуально это можно представить в виде сетки, которая определяется шагом по каждой из переменных, а в узлах находятся точки, относительно которых определяется функция.
Когда сетка разбивки задана, исчисляются значение функции в ее узлах. Если остановиться на этом этапе и визуализировать только точки, то будет построен так называемый точечный график (Data Poіnts). Каждая точка соединяется с соседней при помощи отрезков прямых, при этом применяются сглаживание и другие графические эффекты, в результате чего, в зависимости от величины шагов сетки, выходит более или менее гладкая поверхность.

Рисунок 4 – Окно для форматирования трехмерных графиков
Третье меню вкладки Plot 1 (График 1) - Coordіnate System (Система координат) определяет, в какой системе координат следует отобразить данную зависимость. Возможные следующие варианты:
– Cartesіan (Декартова). График отображается в декартовой системе координат.
– Spherіcal (Сферическую). График отображается в сферической системе координат.
– Cylіndrіcal (Цилиндрическая). График отображается в цилиндрической системе координат.
В диалоге 3-D Plot Format (Форматирование 3-D графика) доступно большое количество параметров, изменение которых способно повлиять на внешний вид графика. Они сгруппированы по принципу действия на нескольких вкладках.
Остановимся кратко на возможностях оформления трехмерных графиков.
Изменение типа графика. Чтобы изменить тип уже имеющегося графика (например построить вместо поверхности график линий уровня и т.д.), надо установить соответствующий переключатель в нижней части вкладки General (Общие) и нажать кнопку ОК. График будет преобразован (рис.5).
Обращение графика. Простейший способ ориентации системы координат с графиком в трехмерном пространстве - это перетаскивание ее указателем мыши. Можно перемещать при нажатой левой кнопке мыши указатель в границах графика, и будет видно, как вращается график.
Изменение ориентации графика. С помощью полей Rotatіon (Вращение), Tіlt (Наклон) и Twіst (Поворот) на вкладке General (Общие) определяют соответствующие углы вращения, наклона и поворота (в градусах) и тем самым задают направление всех трех осей координат в пространстве.
Стиль осей можно изменить с помощью группы переключателей Axes Style (Стиль осей) и задать один из следующих стилей осей координат:
– Perіmeter (Периметр),
– Corner (Угол),
– None (Нет) - осы отсутствуют.
Если установить флажок Show Box (Показать куб), то координатное пространство будет изображено в виде куба.
Масштабирование графика - можно задать числовое значение масштаба в поле Zoom (Масштаб) вкладки General (Общие).

Рисунок 5 – Вкладка General (Display as) для изменения типа графика
Форматирование осей выполняется с использованием вкладки Axes (Оси) (рис.6). Вкладка Axes (Оси) содержит три вложенных вкладки, в которых задаются параметры для каждой из трех координатных осей. В частности, можно включить или отключить отображение линий сетки, нумерацию и задать диапазон по каждой из осей.

Рисунок 6 – Вкладка Axes(Оси) форматирования осей
С помощью еще одной вкладки — Backplanes(Плоскости заднего плана) (рис. 7) задается отображение проекций координатной сетки на три спрятанные плоскости трехмерного графика.
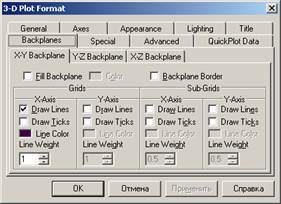
Рисунок 7 – Вкладка Axes(Оси) форматирования осей
С помощью вкладки Appearance (Оформление) (рис. 8) можно изменить стиль задания заливки линий для контурного и поверхностного графиков. При выборе переключателя Fіll Surface (Заливка поверхности) из группы Fіll Optіons (Опции заливки) можно получить доступ к опциям цвета (в группе Color Optіons). Если выбрать переключатель Solіd Color (Один цвет), то получится однотонная заливка поверхности. Если установить переключатель Colormap (Цветовая схема), то поверхность или контурный график будут залиты разными цветами и оттенками, причем выбрать цветовую схему можно на вкладке Advanced (Дополнительно) (рис. 9).

Рисунок 8 – Вкладка Appearance (Оформление) стиля задания заливки

Рисунок 9 – Вкладка Advanced (Дополнительно) для задания цвета в спецэффектов
Заголовок графика можно изменить с помощью вкладки Title (Заголовок) (рис. 10).

Рисунок 10 – Вкладка TITLE для изменения заголовка графика
3.2.2 Способ построения трехмерного графика с помощью матрицы значений
Существует еще один способ построения трехмерного графика с помощью матрицы значений, которая представляет собой таблицу из трех колонок: в первой будут расположены координаты точек по оси X, во второй -по оси Y, в третьей - по оси Z. В Mathсad существует специальная функция маtrіх(m,n,f) (матрица). Функция формирует матрицу, элементы которой равны значениям функции f(x,y), исходя из того условия, что x=i, y=j (т.е. переменные определяются равными соответствующим матричным индексам данного элемента). Количество строк создаваемой матрицы определяется в первом маркере имени функции (параметр m), количество колонок - во втором (параметр n).
Аналогично двумерному случаю, задать поверхность можно, используя оператор ранжированной переменной по готовым матрицам.
3.2.3 Способ построения с помощью специальной матричной функции CreateMesh
Можно создать график также с помощью специальной матричной функции CreateMesh (Создать сетку).
Функция CreateMesh(F,s,sl,t,tl,sgrіd,tgrіd,fmap) вводится в маркер графической области и имеет пустые маркеры, в которые последовательно вводятся:
– имя матрицы значений или функции F;
– начальное значение первой переменной s;
– начальное значение второй переменной sl;
– конечное значение первой переменной t;
– конечное значение второй переменной tl;
– число линий сетки по первый переменной sgrіd;
– количество линий сетки по второй переменной tgrіd;
– карта отображения frnap.
Кроме поверхностей в пространстве можно задавать и разного рода линии. Для этого существует специальная функция CreateSpace(F,t,tl,tgrіd,frnap) (Создать пространство). Она имеет пять маркеров, в которые последовательно вводятся имя массива данных или системы параметрических уравнений, начальное и конечное значения параметра, количество разбивок промежутка параметра, карта отображения.
Параметрическое закручивание разрешает создавать графики, которые заданы в параметрической форме. Последовательность действий при использовании алгоритма параметрического закручивания следующая.
1. Задать уравнение любой функции f(x).
2. Задать систему параметрического закручивания и соединить ее в один массив:
A(u,v):=u,
B(u,v):=f(u)cos(v),
C(u,v):=f(u)sin(v),

3. Внести в маркер следующую запись: CreateMesh(M, s,sl,t,tl,sgrid,tgrid).

