Общие сведения
В MathCAD встроено несколько различных типов графиков, которые можно разбить на две большие группы.
Двумерные графики:
· X-Y (декартовый) график (X-Y Plot);
· полярный график (Polar Plot).
Трехмерные графики:
· график трехмерной поверхности (Surface Plot);
· график линий уровня (Contour Plot);
· трехмерная гистограмма (3D Bar Plot);
· трехмерное множество точек (3D Scatter Plot);
· векторное поле (Vector Field Plot).
Деление графиков на типы несколько условно, т. к., управляя установками многочисленных параметров, можно создавать комбинации типов графиков, а также новые типы (например, двумерная гистограмма распределения является разновидностью простого X-Y графика).
Для построения графиков используются шаблоны. Их перечень содержится в меню Вставка®Графики. Большинство параметров графического процессора, необходимых для построения графиков, по умолчанию задается автоматически. Поэтому для начального построения того или иного вида достаточно задать тип графика. В подменю Graph содержится список из семи основных типов графиков. Рассмотрим их более подробно в следующей таблице.
| Название | Назначение |
| X-Y Plot (График X-Y) | Служит для построения графика функции y=f (x) в виде связанных друг с другом пар координат (xi,yi) при заданном промежутке изменения для i. |
| Polar Plot (Полярный график) | Служит для построения графика функции r (q), заданной в полярных координатах, где полярный радиус r зависит от полярного угла q. |
| Surfase Plot (График поверхности) | Служит для представления функции z=f (x,y) в виде поверхности в трехмерном пространстве. При этом должны быть заданы векторы значений xi и yj, а также определена матрица вида Ai,j=f (xi,yj). Имя матрицы A указывается при заполнении рамки-шаблона. С помощью этой команды можно строить параметрические графики. |
| Contour Plot (Линии уровня) | Строит диаграмму линий уровня функции вида z=f (x,y), т.е. отображает точки, в которых данная функция принимает фиксированное значение z=const. |
| 3D Scatter Plot (3D-график разброса) | Служит для точечного представления матрицы значений Ai,j или отображения значений функции z=f (x,y) в заданных точках. Эта команда может также использоваться для построения пространственных кривых. |
| 3D Bar Chart (Столбчатая 3D-диаграмма) | Служит для представления матрицы значений Ai,j или отображения значений функции z=f(x,y) в виде трехмерной столбчатой диаграммы. |
| Vector Field Plot (Векторное поле) | Служит для представления двухмерных векторных полей V= (Vx,Vy). При этом компоненты векторного поля Vx и Vy должны быть представлены в виде матриц. При помощи этой команды можно построить поле градиента финкции f (x,y). |
MathCAD представляет пользователю разнообразные средства форматирования графика ‑ изменение толщины и цвета линий, вида осей координат, координатные сетки, текстовые комментарии и др. Для того чтобы изменить вид изображения, нужно щелкнуть дважды по полю графика и установить требуемые параметры в окнах настройки.
Графики любого вида, как любые объекты документа, можно выделять, заносить в буфер обмена, вызывать их оттуда и переносить в любое новое место документа. Их можно и просто перетаскивать с места на место курсором мыши, а также растягивать по горизонтали, по вертикали и по диагонали, цепляясь за специальные маркеры выделенных графиков курсором мыши.
Порядок действий при построении всех графиков одинаков. После выбора шаблона построения графика в рабочем документе открывается поле построения графика с помеченными для ввода позициями, которые нужно заполнить для определения графика.
Когда график определен (заполнены все помеченные позиции), то для построения графика при автоматическом режиме вычислений достаточно щелкнуть мышью вне поля графика.
Заполнение шаблона для разных типов графиков имеет свои особенности.
Порядок построения двумерного графика в декартовой системе координат рассмотрен в лабораторной работе №1. Используя аналогичную технологию, можно построить один или несколько графиков на одном и том же чертеже в полярных координатах.
Форматирование графиков
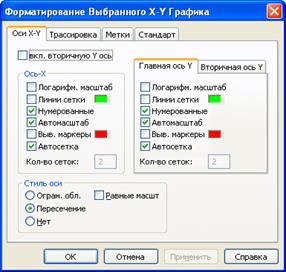
Чтобы изменить формат графика, необходимо дважды щелкнуть мышью в области графика. Форматирование оси графика можно также произвести, выполнив на ней двойной щелчок.
Если строим график в декартовой системе координат, то появится следующее диалоговое окно для форматирования графика (разные типы графиков имеют разный вид диалоговых окон, но аналогичную технологию форматирования).
В MathCAD можно делать следующие надписи на чертеже:
· заголовок выше или ниже графика;
· названия осей, чтобы описать, что отложено на каждой оси;
· имена кривых, идентифицирующих отдельные графики;
· переменные ‑ выражения, определяющие координаты.
Можно использовать эти надписи все вместе или в любой комбинации.
Для того чтобы добавить заголовок к графику в диалоговом окне для форматирования графика, следует щелкнуть по закладке Labels (Метки) и напечатать заголовок графика в поле Title (Название). Пометить место размещения заголовка: кнопка Above (Вверху) или Below (Внизу) и удостовериться, что флажок Show Title (Выводить) отмечен.
Чтобы надписать одну или обе оси графика, необходимо указать название осей в поле Метки осей.
Каждому графику соответствует строка в прокручивающемся списке, который откроется, если в диалоговом окне для форматирования графика щелкнуть по вкладке Traces (Трассировка). На этой вкладке можно изменить параметры: обозначение в легенде (Легенда – текст, который отображается в нижней части графической области, рядом с каждой легендой отображается тип линии соответствующей кривой), символ для обозначения точек кривой (плюс, крестик, кружок и т.п.), размер и частота символов, тип, цвет, толщину линии.
По мере появления новых графиков MathCAD ставит в соответствие каждому графику одну из этих строк.
Пример 1
|
Построение кривой, заданной параметрически
В случае построения параметрически заданной кривой, вместо независимой переменной x под осью абсцисс необходимо задать индексированую переменную xi. А рядом с осью ординат необходимо соответственно указать yi.
Для нанесения на график функции отдельных точек, их координаты указываются через запятую под осью абсцисс и слева от оси ординат. Если требуется вывести множество точек, то можно сформировать два вектора, один из которых содержит абсциссы точек, а другой - их ординаты. В этом случае на графике в соответствующих ячейках указываются только имена векторов.
Пример 2


Графики в полярной системе координат
В полярной системе координат каждая точка задается углом j и модулем радиуса-вектора r(j). График функции обычно строится в виде линии, которую описывает конец радиуса-вектора при изменении угла j в определенных пределах, чаще всего от 0 до 2p. Опция Полярные координаты (Polar Plot ) выводит шаблон таких графиков в форме окружности с шаблонами данных.
Перед построением таких графиков надо задать значения переменной j как ранжированной переменной и функцию r(j). Форматирование графиков производится аналогично графикам в декартовой системе координат.
Пример 3


Графики поверхностей
Трехмерные, или 3D-графики, отображают функции двух переменных вида Z(X, Y).
При построении трехмерных графиков в ранних версиях MathCAD поверхность нужно определить математически. В более поздних можно также применять функцию CreateMesh.
Функция CreateMesh (F (или G, или f1, f2, f3), x0, x1, y0, y1, xgrid, ygrid, fmap) ‑ создает сетку на поверхности, определенной функцией F. Здесь x0, x1, y0, y1 – диапазон изменения переменных; xgrid, ygrid – размеры сетки переменных; fmap – функция отображения. Все параметры, за исключением F, - факультативные. По умолчанию функция CreateMesh создает сетку на поверхности с диапазоном изменения переменных от –5 до 5 и с сеткой 20´20 точек.

|

|


 Пример 4 (Построение графиков поверхности двумя способами)

|

|

Нередко поверхности и пространственные кривые представляют в виде точек, кружочков или иных фигур. Такой график создается операцией Вставка ® График ® 3D Точечный, причем поверхность задается параметрически – с помощью трех матриц (X, Y, Z).
Для определения исходных данных для такого вида графиков используется функция CreateSpace.
Функция CreateSpace (F, t0, t1, tgrid, fmap) ‑ возвращает вложенный массив трех векторов, представляющих х, у, и z ‑ координаты пространственной кривой, определенной функцией F. t0 и t1 – диапазон изменения переменной, tgrid – размер сетки переменной, fmap – функция отображения.
Пример 5 (Построение точечного графика двумя способами)
Еще один вид представления поверхности ‑ векторное представление. Оно задается построением коротких стрелочек ‑ векторов. Стрелки обращены острием в сторону нарастания высоты поверхности, а плотность расположения стрелок зависит от скорости этого нарастания.
Для его построения используется шаблон Vector Field Plot (график векторного поля на плоскости). В шаблон необходимо внести имя матрицы M.
Пример 6.


Построение пересекающихся фигур
Особый интерес представляет собой возможность построения на одном графике ряда разных фигур или поверхностей с автоматическим учетом их взаимного пересечения. Для этого надо раздельно задать матрицы соответствующих поверхностей и после вывода шаблона 3D-графика перечислить эти матрицы под ним с использованием в качестве разделителя запятой.