


«накомство с возможност€ми проведени€ дискриминантного анализа в системе Statistica 6 лучше всего начать с разбора апробированного примера. “аким примером €вл€етс€ классический пример ‘ишера Ц анализа цветков ириса.
«адача состоит в том, чтобы по результатам измерени€ длины и ширины чашелистиков и лепестков цветков ириса отнести ирис к одному из трех типов: SETOSA, VERSICOL, VIRGINIC.
ƒанные дл€ этого примера имеютс€ в файле Irisdat.sta. ¬ файле содержатс€ результаты измерений 150 цветков ириса, по 50 каждого типа.
Ўаг 1. Ќажмите кнопку Open Data (ќткрыть данные) и откройте файл данных Irisdat.sta из каталога Examples (ѕримеры на диске —). —ледующий файл данных по€витс€ на экране (рисунок 15.1).

–исунок 15.1 Ц ‘айл данных Iris.sta
Ўаг 2. »з ѕереключател€ модулей Statistica откройте стартовую панель модул€ Discriminate function analysis (ƒискриминантный функциональный анализ) (рисунки 15.2, 15.3).

–исунок 15.2 Ц «апуск модул€ ƒискриминантный анализ

–исунок 15.3 Ц —тартова€ панель модул€ ƒискриминантный анализ
Ўаг 3. —делайте установки, как показано на рисунке 15.3. ƒл€ этого нажмите кнопку Variables (ѕеременные)и выберите переменные дл€ анализа.
¬ качестве Grouping variable (√руппирующа€ переменна€ ) выберите переменную Iristype (“ип ириса) (рисунок 15.4).
¬ качестве Independent variables (Ќезависимые переменные) выберите переменные Sepallen, Sepalwid, Petallen, Petalwid (ƒлина чашелистника, ширина чашелистника, длина лепестка, ширина лепестка) (рисунок 15.4). Ќажмите кнопку ќK.
¬ыполните установку Codes for grouping variable ( оды дл€ группировки переменных) ( рисунок 15.5). Ќажмите кнопку ќK.

–исунок 15.4 Ц ”становка переменных (Variables)

–исунок 15.5 Ц ”становка кодов дл€ группировки переменных
Ўаг 4. Ќажмите кнопку ќK и откройте диалоговое окно Model Definition ( ќпределение модели) (рисунок 15.6).
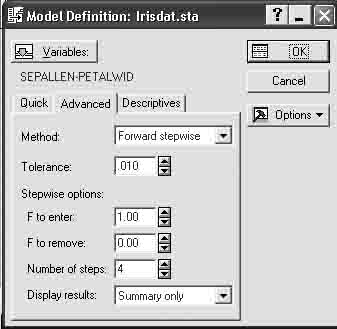
–исунок 15.6 Ц ќкно определени€ модели дискриминантного анализа
Ўаг 5. —делайте установки, как показано на рисунке 15.6. Ќажмите кнопку OK и запустите вычислительную процедуру, реализующую пошаговый метод включени€.
Ўаг 6. ¬сесторонне просмотрите итоги в диалоговом окне Discriminant Function Analysis Results (–езультаты дискриминантного анализа) (рисунок 15.7).

–исунок 15.7 Ц ќкно результатов дискриминантного анализа данных
из файла Iris.sta
»нформационна€ часть окна сообщает, что использовано:
- Stepwise analysis (ѕошаговый анализ), Step 4 Final step
(4 шага);
- Number of variables in the model („исло переменных в модели): 4;
- Last variable entered (ѕоследн€€ включенна€ переменна€): Sepallen, соответствующее значение статистики F-критери€
(F (2, 144) = 4,72), уровень значимости р < 0,01;
- Wilks lambda («начение л€мбды ”илкса): 0,02;
- approx. F (4,292) = 199,14 (ѕриближенное значение
F - статистики), св€занной с л€мбдой ”илкса;
- р Ц уровень значимости F-критери€ дл€ значени€ 199,14;
- значени€ статистики л€мбда ”илкса лежат в интервале 0 Ц 1.
|
|
|
«начени€ статистики ”илкса, лежащие около нул€, свидетельствуют о хорошей дискриминации. «начени€ статистики ”илкса, лежащие около единицы, свидетельствуют о плохой дискриминации.
»ными словами, это можно выразить следующим образом: если значени€ л€мбды ”илкса близки к нулю, то мощность дискриминации (мощность = 1 Ц веро€тность ошибки) близка к 1, если л€мбда ”илкса близка к единицы, то мощность близка к нулю.
Ўаг 7. Ќажмите кнопку Variables in the model (ѕеременные, включенные в модель). Ќа экране по€витс€ итогова€ таблица анализа (рисунок 15.8).

–исунок 15.8 Ц »тогова€ таблица анализа данных из файла Iris.sta
Ўаг 8. ѕросмотрите разделение групп на графике. ƒл€ этого инициируйте кнопку Perform Canonical analysis ( анонический анализ). ¬ по€вившемс€ диалоговом окне Canonical Analysis (канонический анализ) нажмите кнопку Scatterplot of canonical scores
(ƒиаграмма рассе€ни€ канонических значений). Ќа экране по€витс€ следующий график (рисунок 15.9).
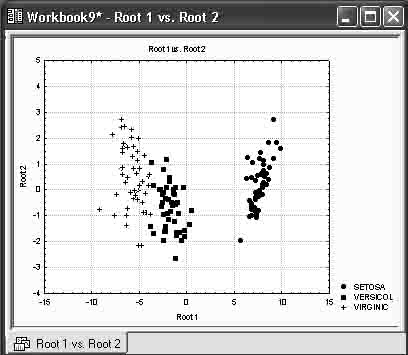
–исунок 15.9 Ц –азделение трех типов ириса
Ўаг 9. ѕросмотрите функции классификации. ¬ диалоговом окне –езультаты дискриминантного анализа нажмите кнопку Classification functions (‘ункции классификации) (рисунок 15.10).

–исунок 15.10 Ц ‘ункции классификации, построенные пошаговым Forward stepwise (методом вперед)
— помощью этих функций можно вычислить классификационные значени€ (метки) дл€ вновь наблюдаемых цветков по формулам:
SETOSA = Ц16,43*Sl+23,69*SwЦ17,4*Pl+23,54*PwЦ86,31;
VERSICOL = 5,21*Sl+7,07*SwЦ6,43*Pl+15,70*PwЦ72,85;
VIRGINIC = 12,76*Sl+3,69*SwЦ21,08*Pl+12,5*PwЦ104,37,
где:
- Sl Ц Sepallen;
- Sw Ц Sepalwid;
- Pl Ц Petallen;
- Pw Ц Petalwid.
ѕусть вы имеете новый цветок со значени€ми: Sepallen, Sepalwid, Petallen, Petalwid.
какому типу ириса его отнести? ‘ормально следует подставить эти значени€ в приведенные выше формулы и вычислить классификационные значени€ SETOSA, VERSICOL, VIRGINIC.
Ќовый цветок относитс€ к тому классу, дл€ которого классификационное значение максимально.
онечно, построенные классификационные функции могут быть определены в электронных таблицах как формулы, и дл€ каждого добавленного случа€ по ним могут быть вычислены классификационные метки. “аким образом, каждый новый объект автоматически относитс€ к определенному классу.
Ўаг 10. Ќажмите кнопку Squared Mahalanobis distance ( вадрат рассто€ни€ ћахаланобиса) ивы увидите таблицу с квадратами рассто€ни€ ћахаланобиса от точек (случаев) до центров групп
(рисунок 15.11).
–исунок 15.11 Ц –ассто€ни€ ћахаланобиса дл€ данных
из файла Iris.sta
—лучай относитс€ к группе, до которой рассто€ние ћахаланобиса минимально.
Ўаг 11. јпостериорные веро€тности.
–ассмотрите группу опций внизу диалогового окна –езультаты дискриминантного анализа: A priori classifications probabilities (јприорные веро€тности классификации). ƒо анализа вы задаете дл€ каждого объекта (в данном примере цветка) веро€тность, с какой он принадлежит к определенному классу. ѕосле того как анализ выполнен, можно пересчитать эти веро€тности и получить апостериорные веро€тности классификации. Ќажав кнопку Posterior probabilities (јпостериорные веро€тности), вы увидите таблицу с апостериорными веро€тност€ми принадлежности объекта к определенному классу (рисунок 15.12).
–исунок 15.12 Ц “аблица апостериорных веро€тностей
»нтерпретаци€ данной таблицы очень проста. ¬ первом столбце указан тип ириса дл€ каждого случа€. ¬о втором, третьем, четвертом столбцах даны апостериорные веро€тности отнесени€ каждого цветка к определенному типу.
|
|
|
÷веток относитс€ к группе с максимальной апостериорной веро€тностью.
«наком * отмечаютс€ неправильно классифицированные при использовании данного правила случаи (5, 9, 12). ¬ исходной таблице (рисунок 15.1) необходимо внести изменени€, а затем заново выполнить процедуру дискриминантного анализа.
Ўаг 12. лассификаци€ новых случаев.
Ќе закрыва€ диалога –езультаты дискриминантного анализа, добавьте в таблицу исходных данных новый случай (151 строка на рисунке 15.13).

–исунок 15.13 Ц Ќовое наблюдение в данных Iris.sta
Ўаг 13. «апустите процедуру дискриминантного анализа. ƒл€ того чтобы пон€ть, к какому классу относитс€ этот объект, нажмите кнопку Posterior probabilities (јпостериорные веро€тности), вы увидите ту же таблицу с апостериорными веро€тност€ми, к которой будет добавлена строка (рисунок 15.14).

–исунок 15.14 Ц лассификаци€ нового наблюдени€
»так, новое наблюдение с веро€тностью 0,999 можно отнести к типу SETOSA.
«адани€ дл€ выполнени€
1 —оздайте пустую электронную таблицу Spreadsheet.sta.
2 ¬несите данные дл€ выполнени€ расчетов, наход€щиес€ в ѕриложении ∆ (таблица ∆1).
¬ыполните процедуры дискриминантного анализа в соответствии с пор€дком операций, выполненных в насто€щем разделе.
ƒайте объ€снение полученным результатам.
»з таблицы 1.1 внесите новые данные.
«апустите процедуру дискриминантного анализа.
¬несите поправки в исходную таблицу, пополнив обучающую выборку новой информацией.
“аблица 15.1 Ц лассификаци€ новых случаев
| 1 задание | 2 задание | 3 задание | ||||||||
| ласс | 1 призн. | 2 призн. | 3 призн. | 4 призн. | ласс | 1 призн. | 2 призн. | ласс | 1 призн. | 2 призн. |
| 1,14 | 1,26 | 0,99 | 2,06 | 0,738 | 0,658 | 36,63 | 31,29 | |||
| 0,79 | 0,84 | 1,17 | 2,72 | 0,612 | 0,243 | 24,84 | 19,63 | |||
| 1,01 | 1,16 | 1,06 | 1,4 | 0,774 | 0,233 | 17,78 | 13,00 | |||
| 0,97 | 1,11 | 0,73 | 0,98 | 0,933 | 0,271 | 5,17 | 1,92 |
Ћабораторна€ работа 16
лассификаци€
(кластерный анализ в Statistica 6)
÷ель работы: научитьс€ на основе применени€ метода k-means clustering (k-средних) Statistica 6 исходную совокупность объектов разделить на кластеры или группы (классы) схожих между собой объектов.

