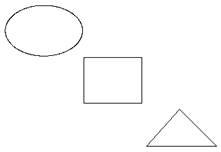
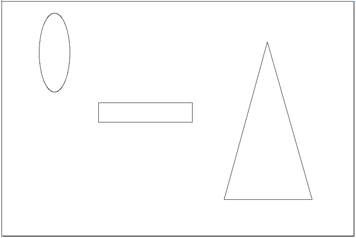
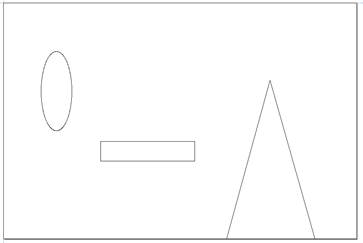
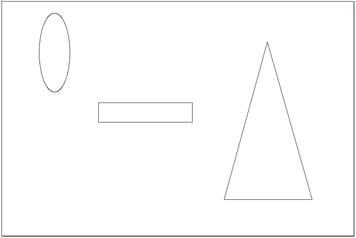
After the selection of more than two pixels, click the [center horizontal alignment] on the left side of the tool bar  or press the [E] button on the keyboard and all the selected pixels will be horizontally center-aligned.

Before Alignment Figure3-24

After Alignment Figure3-25
Right horizontal alignment
After the selection of more than two pixels, click the [right horizontal alignment] on the left side of the tool bar  or press the [R] button on the keyboard and all the selected pixels will be right-aligned.

Before Alignment Figure3-26

After Alignment Figure3-27
Top vertical alignment
After the selection of more than two pixels, click the [top vertical alignment] on the left side of the tool bar  or press the [T] button on the keyboard and all the selected pixels will be top-aligned.

Before Alignment Figure3-28

After Alignment Figure3-29
Center vertical alignment
After the selection of more than two pixels, click the [center vertical alignment] on the left side of the tool bar  or press the [C] button on the keyboard and all the selected pixels will be vertically center-aligned.

Before Alignment Figure3-30

After Alignment Figure3-31
Bottom vertical alignment
After the selection of more than two pixels, click the [bottom vertical alignment] on the left side of the tool bar  or press the [B] button on the keyboard and all the selected pixels will be bottom-aligned.

Before Alignment Figure3-32

After Alignment Figure3-33
Alignment of pixels with breadth
Align all selected pixels and formats with all exterior rectangles of the selected pixels as the reference. In case of no pixels being selected, all pixels will be defaulted as being selected.
Top alignment of pixels with breadth
Click the Ў°top alignmentЎ± tool  on the left side of the top tool bar and the selected or all pixels will be aligned with the top of the breadth with the exterior rectangle as the reference.

Before Alignment Figure3-34

After Alignment Figure3-35
Bottom alignment of pixels with range
Click the Ў°bottom alignmentЎ± tool  on the left side of the top tool bar and the selected or all pixels will be aligned with the bottom of the breadth with the exterior rectangle as the reference.

Before Alignment Figure3-36

After Alignment Figure3-37
Alignment of pixels with breadth center
Click the Ў°center alignmentЎ± tool  on the left side of the top tool bar and the selected or all pixels will be aligned with the center of the breadth with the exterior rectangle as the reference.

Before Alignment Figure3-38

After Alignment Figure3-39
Group
The group toolbar is as shown in Figure 3-40:

Figure 3-40
From left to right, they are Group, Dissolve Group and Dissolve All Groups
 is the group tool, making all currently selected pixels into one group and does not support nested group; if there is groups in currently selected pixels, the groups will be scattered for regrouping.
 is the tool for canceling groups, dissolving currently selected groups. The Ў°dissolutionЎ± function is only for dissolving currently selected groups.
 is the tool for canceling all groups, being able to dissolve all groups in the selected graphs (including group nesting).
Graph Array
Virtual array
Dialog box toolbar on the right side of the softwareЎЇs main interface, the Ў°ArrayЎ± of the second page is as shown in Figure 3-41. If double-laser head is needed for processing, please select virtual array for typesetting:

Figure 3-41
After the selection of pixels, enter the interval (the interval among pixels) and click the [Fully Occupied] button to pop up the dialog box of automatic fully-occupied setting. As shown in Figure 3-42, enter the breadth to be arrayed (width and height) and click the [Application] button and the software will calculate the row number, the column number and the remaining size in the designated breadth according to the width, height and interval entered by users; refresh the calculated row and column number to the Ў°ArrayЎ± page, as shown in Figure 3-43 and generate virtual pixels, as shown in Figure 3-44.

Figure3-42

Figure 3-43

Figure 3-44
As shown in Figure 3-41, if full occupancy is not required, after entering the row number y & interval and column number x & interval after the selection of the pixels, click [Application] and pixels will be generated.
Real array
Select the pixels to be arrayed. Real array is at the top of the second Ў°ArrayЎ± of the dialog box on the right side of the softwareЎЇs main interface, as shown in Figure 3-45:

Figure3-45
[Fully Occupied]: the application method of real array is the same as that of virtual array. What makes them different is that the pixel finally generated is real pixel in real array, while that in virtual array is virtual.
Color Attribute
Color toolbar in the software is as shown in Figur3-46:

Figure 3-46
There are 256 colors optional for users. One color represents one layer and each layer can be set with different processing parameters and different layers as well, reaching the processing sequence of setting different graphs for different layer.

Figure 3-47
Graph color
The software has its own color list. If the opened graph document has color information, the software will select the most similar color in the list according to each color; if there is no color information in the opened graph (for example, PLT is only with pen number), the software will transfer its color as that in the color list of the graph in turn. Therefore, for documents with relatively complicated color or without color information, though the color displayed after being opened may be different from that in other software, the color type remains the same.
Creating new layers
Click a certain color by the left mouse button to draw and the newly generated graph will use the selected color.

Select Color Figure 3-48

Draw Graphs Figure 3-49


