


В окне Descriptive Statistic во вкладке Quick нажмем на кнопку Frequency Tables, в появившемся окне выделим необходимый нам столбец переменных Var1, нажмем OK. В результате получим таблицу частот (см. рис. 1.6). В первом столбце заданы интервалы для переменной  , причем последняя строка содержит пропущенные значения. Второй столбец содержит число попаданий переменной в интервалы (Count), третий столбец – кумулятивное число попаданий (Cumulative Count), четвертый и шестой – частоты в процентных соотношениях для имеющихся в наличии (не пропущенных) наблюдений (Percent of Valid) и для всех наблюдений (% of Cases), пятый и седьмой столбцы – кумулятивные частоты в процентах соответственно для (не пропущенных) наблюдений (Cumul. % of Valid) и для всех наблюдений (Cumul. % of All).
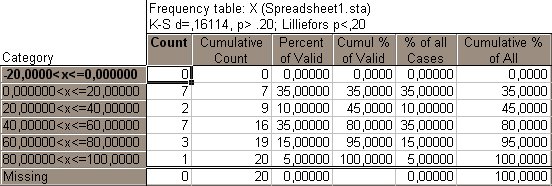
Рис. 1.6. Таблица частот
Для построения графиков частот и кумулятивных частот выделим столбцы Percent of valid, нажмем правую кнопку мыши и в контекстном меню выберем команду Graph of Block Data – Line Plot: Entire Columns (так как данные для построения графика расположены в столбцах).
Для построения гистограммы частот вернемся в окно Descriptive Statistic (оно располагается внизу основного окна в свернутом состоянии). С помощью функциональной кнопки Histograms получим гистограмму. Кроме гистограммы частот на рисунке также будет показана теоретическая кривая плотности распределения наблюдаемой случайной величины в случае нормального распределения.
Для построения диаграммы размаха варьирования, в окне Descriptive Statistic во вкладке Quick нажмем на функциональную кнопку Box&Wisker Plot. В результате получим диаграмму размаха (график “ящик с усами”), которая показывает, как отклоняются данные от среднего значения. Если необходимо зажать дополнительные параметры диаграммы размаха варьирования, то необходимо выбрать вкладку Options в окне Descriptive Statistic.