


Рис.2
Рис.1
2. Создаем группу, в ряды данных которой вставляем необходимые наблюдения: зарплату, тип населенного пункта, образование, пол респондента, стаж работы.
3.  Для этого из Excel - документа копируем необходимые данные, в строчке “obs” ввожу название рядов, нажимаю “Enter”. В открывшемся диалоговом окне “Create and add to group” выбираю “Numeric series”. Нажимаю “Ok”. Вставляем данные с помощью команды Paste. В итоге получаем группу “First”– после задания ее имени, и в соответствии с рассматриваемыми объектами 5 рядов данных.
Рис. 3
4. 
 Для графического анализа данных с помощью команд line place, line pol, line education, line salary, line stag по каждому из рядов создадим графики и сохраним их.
По данным графиков можно сказать следующее:
1. По типу населенных пунктов – выводы сделать довольно сложно, т.к. график почти не читаем, но можно заметить, что большая часть живет в городах и поселках городского типа, а также в областных центрах.
Рис. 4 (Графики:4.1;4.2; 4.3; 4.4; 4.5)
2. По половому признаку – больше женщин
3. По образованию – по графику мы можем судить, что большая часть респондентов закончила как минимум 8 классов и получила дипломы о высшем образовании, но есть исключения люди, имеющие образование равное 4 классам и ниже, и наоборот – аспиранты с дипломами. Поэтому мы позже для наглядности введем ограничения по данному показателю.
4. По среднемесячной заработной плате – у нас большой разбег, график тоже мало читаем, т.к. несколько индивидов имеют очень заработную плату большая же часть вообще по сравнению с ними на нуле. График непонятен, значит, потом будем вводить ограничения по данному показателю.
5. По стажу – Основная часть респондентов работают от 5-15 лет.
Для анализа совместного поведения исследуемых величин построим графики с помощью команд: line salary place, line salary pol, line salary education, line salary stag.
 Рис.5 (Графики: 5.1; 5.2;5.3;5.4)
Сложно делать какие то выводы, т.к. графики ненаглядные и переменные не сопоставимые: показатели заработной платы. - слишком большие по сравнению с показателями образования, пола, места проживания и стажа. Необходимую фильтрацию проведем ниже.
Проведем анализ диаграмм рассеяния.
Для этого используем команду “Scat” получим облака рассеяния или графики зависимости заработной платы от исследуемых показателей. Но перед этим проведем фильтрацию данных для удобства и большей наглядности. Для этого заходим в команду Quick->Sample и в диалоговом окне “Sample” вводим следующую команду:

Рис.6
Теперь сделаем графики зависимости, и проанализируем совместное поведение величин:

Рис.7 (Графики: 7.1; 7.2; 7.3; 7.4)
Анализирую данные диаграммы можно сделать следующие выводы:
1. График 7.1 – самая высокая заработная плата в областных центрах, причем здесь представлена заработная плата как максимального, так и минимального значения. В городе также большой разбег заработной платы, здесь больше заработных плат в диапазоне от 0 до 10000 тыс.р. В поселках городского типа заработная плата невысокая, а разбег от 0 до 20000, причем наиболее часто встречаемая – от 0 до 8000. На селе разбег заработной платы от 0 до 20000, но наиболее часто встречаемая заработная плата в диапазоне от 0 до 5000. Заработная плата зависит от населенного пункта в областном центре она выше, чем в городе, поселениях городского типа и на селе.
2. График 7.2 – так как женщин больше по численности, то и соответственно у них более плотное облако рассеяния. Они получают заработную плату от 0 до приблизительно 20000, однако большее их число получает небольшую заработную плату от 0 до 12000 р. Разбег заработной платы у мужчин от о до приблизительно 30000. Наиболее часто встречаются заработная плата от 0 до 20000. Заработная плата зависит от пола, женщины в среднем получают меньше чем мужчины
3. График 7.3 – Только те кто закончили аспирантуру с дипломом получают самую большую заработная плату но их единицы, наиболее часто встречаются те, кто закончил вуз – у них довольно высокие показатели заработной платы от 8000 до 18000. Те кто закончил техникумы получают значительно меньше, здесь чаще всего встречаются заработная плата от 0 до 7000, а те кто только получил только школьное образование еще меньше от 0 до 5000. Хотя везде есть исключения. Таким образом, заработная плата зависит от уровня образования: чем он выше, тем и зарплата больше, связь прямая.
4. График 7.4 – В основном самая высокая заработная плата у населения со стажем работы 10 лет. Но и со стажем от 20 лет заработная плата не идет на увеличение, есть те, кто получают минимум и те, кто получают максимум. Таким образом, заработная плата слабо зависит от стажа работы.
Рассчитаем выборочные коэффициенты корреляции:
Для расчета выборочных коэффициентов корреляции для заработной платы и всех исследуемых показателей открываем группу “First”, в меню выбираем команды: View/Correlations/Common Sample.
Получаем:
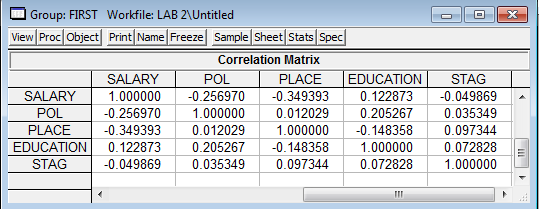
Рис.8
Теперь проанализируем результаты: Корреляция говорит нам о функциональной связи заработная плата и исследуемых переменных.
· Связь заработной платы и пола – обратная и слабая;
· Связь заработной платы и местности - обратная и умеренная;
· Связь заработной платы и образования - прямая и слабая;
· Связь заработной платы и стажа - обратная и слабая.
Проведем анализ выборочных характеристик рядов данных. Определим соразмерность колебаний.
Сопоставим полученные выводы с выводами, сделанными при проведении графического анализа и анализа графиков зависимости.
Для этого в каждом из рядов кроме места проживания, пола и стажа (так как они лишены смысла), View/Descriptive Statistics/Histogram and Stats. Получаем следующие результаты:

Рис. 9
Интерпретация диаграммы:
Mean – средняя арифметическая ряда = 4,6 то есть средний срок обучения составляет = 5 лет.
Median – медиана ряда = 5. При данном значении выборка делится на две части, неравные или почти равные по численности.
Maximum = 6. Это максимальный срок обучения.
Minimum =2. Это минимальный срок обучения.
Std. Dev – стандартное отклонение ряда =1,07, т.е срок обучения опрошенных колеблется на интервале [5-1,07;5+1,07].
Skewness –коэффициент асимметрии = -0,3 - Левосторонняя асимметрия
Kurtosis – коэффициент эксцесса = 2.53 близко к нормальному распределению, у нормального распределения он = 3.
Jarque-Bera -статистика Жарке-Бера = 9,2 и Probability = 0,01 распределение не является нормальным.

Рис. 10
Интерпретация диаграммы:
Mean – средняя арифметическая ряда = 10907.34. т.е средний размер заработной платы составляет = 10907.34рубля
Median – медиана ряда =9800. При данном значении выборка делится на две части, неравные или почти равные по численности.
Maximum = 34500 - Это максимальный размер заработной платы.
Minimum =0 - Это минимальный размер заработной платы.
Std. Dev – стандартное отклонение ряда = 6931.917, то есть основной размер заработной платы у всех опрошенных колеблется на интервале [10907-6101; 10907+6101 ].
Skewness –коэффициент асимметрии = 0.958912. Правосторонняя асимметрия
Kurtosis – коэффициент эксцесса = 3,596850 близко к нормальному распределению, у нормального распределения он = 3.
Jarque-Bera -статистика Жарке-Бера = 63,31776 и Probability = 0, нельзя говорить о нормальном распределении.
Ответы на вопросы:
1. эконометрическая модель - одно или несколько уравнений, описывающих стохастические связи между анализируемыми показателями
2. основные классы моделей в эконометрике: регрессионные модели с одним уравнением; системы одновременных уравнений; модели временных рядов
3. этапы эконометрического моделирования: постановка задачи; анализ предметной области; формулировка модели; сбор данных и анализ их качества; определение параметров модели; верификация (оценка качества модели); интерпретация результатов.
4. Поле корреляции – графическое изображение статистических данных в декартовой системе координат – множество точек с координатами на плоскости.
5. Однородность данных –
6. Если коэффициент корреляции >0, значит связь прямая, если <0 обратная.
7. |r|>0.7 тесная связь; 0.3=<|r|=<0.7 умеренная связь; |r|<0.3 слабая связь
8. Коэффициент корреляции может принимать любые значения в интервале [-1;1]
9. Если стандартное отклонение равно 2,5, это означает, что значение случайной величины отклоняется от среднего значения на 2,5 единицы.

