


÷≈Ћ№ –јЅќ“џ
÷ель работы Ц изучить возможности применени€ финансовых функций MS Excel; рассмотреть особенности программного ввода формулы в €чейку рабочего листа; рассмотреть особенности работы с диаграммами MS Excel.
«јƒјЌ»≈
ѕри открытии рабочей книги по€вл€етс€ пользовательска€ форма, позвол€юща€ ввести информацию о денежных потоках дл€ расчета чистой приведенной стоимости проекта (рис. 1).

–ис. 1. √лавна€ форма
ѕри нажатии кнопки Ђƒобавитьї на рабочий лист добавл€етс€ информаци€ о дате платежа, сумме платежа и ставке дисконтировани€.
ѕри нажатии кнопки Ђ–асчет NPVї рассчитываетс€ чиста€ приведенна€ стоимость.
ѕри нажатии кнопки Ђƒиаграммаї формируетс€ диаграмма платежей.
ѕри нажатии кнопки Ђ¬ыходї главна€ форма скрываетс€.
“≈ќ–≈“»„≈— »≈ —¬≈ƒ≈Ќ»я
ќдно из основных применений Excel Ч это анализ данных. ј дл€ анализа данных часто удобно использовать диаграммы с их специальными возможност€ми. Ќа практике задачи по автоматизации создани€ множества похожих друг на друга диаграмм (обычно на основе информации, полученной из базы данных) возникают очень часто.
— диаграммами в Excel существует некотора€ терминологическа€ путаница. “о, что на графическом интерфейсе русского Excel называетс€ диаграммой (меню ¬ставка | ƒиаграмма), по-английски называетс€ графиком (Chart) и ему соответствует объект Chart. ¬ объектной модели Excel предусмотрен также и объект Diagram, но он представл€ет скорее схему отношений (то, что при помощи графического интерфейса русского Excel можно добавить при помощи меню ¬ставка | —хематическа€ диаграмма).
ѕод диаграммой будет понимать то же, что и у создателей русского Excel Ч обычный график. ƒиаграммы в Excel создаютс€ при помощи объекта Chart. ¬начале лучше этот объект объ€вить: Dim oChart As Chart. ƒальше можно создавать диаграмму. —оздание диаграммы производитс€ при помощи много раз использованного нами приема Ч вызова метода Add() коллекции Charts: Set oChart = ActiveWorkbook.Charts.Add(, ActiveSheet).
¬ принципе, диаграмма уже создана, но поскольку никакие ее свойства не определены, она выгл€дит как пустой лист. „тобы она обрела содержание, необходимо выполнить еще несколько действий. ѕервое (и единственное об€зательное действие) Ч определить источник данных дл€ диаграммы, дл€ чего предназначен метод SetSourceData(). ¬ качестве источника может выступать только объект Range (он передаетс€ в качестве первого и единственного об€зательного параметра этого метода). ¬торой параметр (необ€зательный) определ€ет, в каком пор€дке считывать данные Ч сначала по столбцам, потом по строкам или наоборот. ƒл€ всех остальных параметров будут прин€ты значени€ по умолчанию.
ќднако на практике нужно определить еще хот€ бы тип диаграммы (по умолчанию она будет выгл€деть как "обычна€ гистограмма", т. е. р€д из столбиков разной длины). ƒл€ этой цели используетс€ свойство ChartType, дл€ которого разработчиками предусмотрено 73 значени€. Ќапример, чтобы преобразовать диаграмму в обычный график, можно использовать код вида: oChart.ChartType = xlLineMarkers.
|
|
|
≈ще одна очень распространенна€ задача Ч добавить дополнительные р€ды на диаграмму. ƒл€ этой цели необходимо создать и получить ссылку на объект Series Ч р€д, а потом дл€ р€да определить свойство Values (ему передаетс€ в качестве значени€ объект Range).
ѕользователи часто говор€т, что им необходимо создавать диаграммы не на отдельном листе, а на том же листе, на котором расположены данные. ѕо умолчанию диаграмма создаетс€ в оперативной пам€ти и помещаетс€ на отдельный лист. ≈сли нам необходимо поместить ее на уже существующий лист, то в этом случае ее надо создать вначале на отдельном листе, а затем переместить при помощи метода Location. ќтдельный лист, созданный дл€ диаграммы, при этом автоматически исчезнет: oChart.Location xlLocationAsObject, "Ћист1".
ќстальные многочисленные параметры диаграммы настраиваютс€ при помощи свойств и методов объектов Chart.
ѕќ—Ћ≈ƒќ¬ј“≈Ћ№Ќќ—“№ ¬џѕќЋЌ≈Ќ»я ѕ–ј “»„≈— ќ√ќ «јƒјЌ»я
Ќаше приложение будет состо€ть из рабочей книги MS Excel и формы Ђ‘орма управлени€ проектомї, на которой будут размещены следующие объекты: объекты Label, объекты TextBox, в которые будем вводить дату платежа, сумму платежа и ставку дисконтировани€; кнопка Ђƒобавитьї, кнопка Ђ–асчет NPVї, кнопка Ђƒиаграммаї, кнопка Ђ¬ыходї.
ѕри открытии рабочей книги по€вл€етс€ рабочий лист, на котором поместим кнопку Ђ¬ызов формы управлени€ї (рис. 3), при нажатии на которую будет открыватьс€ главна€ форма приложени€. “акже на рабочем листе создадим шаблон дл€ ввода данных о дате платежа, сумме платежа и ставки дисконтировани€.
1. —оздадим рабочую книгу MS Excel. ѕоместим на рабочий лист 1 кнопку Ђ¬ызов формы управлени€ї. —оздадим шаблон дл€ ввода данных.
2. —оздадим главную форму Ђ‘орма управлени€ проектомї. ¬ыберем команду Insert Ц UserForm. –азместим на ней все необходимые объекты и определим дл€ них все необходимые параметры. ‘орма примет следующий вид (рис. 2):

–ис. 2. √лавна€ форма "‘орма управлени€ проектом"
ѕри нажатии кнопки Ђƒобавитьї на рабочий лист добавл€етс€ информаци€ о дате платежа, сумме платежа и ставке дисконтировани€.
ѕри нажатии кнопки Ђ–асчет NPVї рассчитываетс€ чиста€ приведенна€ стоимость.
ѕри нажатии кнопки Ђƒиаграммаї формируетс€ диаграмма платежей на новом листе Ђƒиаграммаї.
ѕри нажатии кнопки Ђ¬ыходї главна€ форма скрываетс€.
3. Ќапишем код программы:
Сѕри открытии рабочей книги по€вл€етс€ главна€ форма приложени€
Private Sub Workbook_Open()
UserForm1.Show
End Sub
Сќбработчик событи€ нажати€ кнопки Ђ¬ызов формы управлени€ї
Private Sub CommandButton1_Click()
UserForm1.Show
End Sub
Сќбъ€вление глобальной переменной Row Ц номер текущей строки
Public Row As Integer
Сќбработчик событи€ нажати€ кнопки Ђƒобавитьї
Private Sub CommandButton1_Click()
Row = Application.CountA(ActiveSheet.Columns(1)) + 1
Ћист1.Cells(Row, 1).Value = TextBox1.Value
Ћист1.Cells(Row, 2).Value = TextBox2.Value
Ћист1.Cells(2, 3).Value = CDbl(TextBox3.Value)
End Sub
Сќбработчик событи€ нажати€ кнопки Ђ–асчет NPVї
Private Sub CommandButton2_Click()
Row = Application.CountA(ActiveSheet.Columns(1))
Ћист1.Cells(2, 4).FormulaLocal = "=„ѕ—(C2;B2:B" & CStr(Row) & ")"
|
|
|
Сячейка будет желтого цвета
If Ћист1.Cells(2, 4).Value < 0 Then Cells(2, 4).Interior.ColorIndex = 6
Сячейка будет красного цвета
If Ћист1.Cells(2, 4).Value > 0 Then Cells(2, 4).Interior.ColorIndex = 3
End Sub
Сќбработчик событи€ нажати€ кнопки Ђƒиаграммаї
Private Sub CommandButton3_Click()
Dim chrt As Chart
Sheets("Ћист1").Select
Row = Application.CountA(ActiveSheet.Columns(1))
Sheets("ƒиаграмма").Select
ActiveWindow.SelectedSheets.Delete
Sheets("Ћист1").Select
Set chrt = Application.Charts.Add
chrt.SetSourceData Ћист1.Range("B2:B" & CStr(Row))
chrt.ChartType = xlLineMarkers
ActiveChart.SeriesCollection(1).XValues = Ћист1.Range("A2:A" & CStr(Row))
'Ћини€ тренда
ActiveChart.SeriesCollection(1).Trendlines.Add(Type:=xlLinear, Forward:=3, Backward:=0, DisplayEquation:=True, DisplayRSquared:=False).Select
'—оздать новую диаграмму на листе Ђƒиаграммаї
chrt.Location xlLocationAsNewSheet, "ƒиаграмма"
End Sub
Сќбработчик событи€ нажати€ кнопки Ђ¬ыходї
Private Sub CommandButton4_Click()
UserForm1.Hide
End Sub
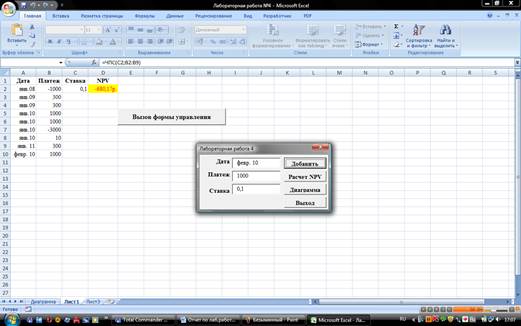
4. ѕроверим работу приложени€. ќткроем книгу Excel. Ќажмем кнопку Ђ¬ызов формы управлени€ї. ¬ результате по€витс€ главна€ форма приложени€ Ђ‘орма управлени€ проектомї (рис. 3).

–ис. 3. √лавна€ форма приложени€
5. ¬ведем дата платежа, сумму платежа и ставку дисконтировани€. Ќажмем кнопку Ђƒобавитьї. Ќовые данные добав€тс€ в конец списка (рис. 4).
–ис. 4. Ќажатие кнопки "ƒобавить"
6. Ќажмем на кнопку Ђ–асчет NPVї. ¬ результате будет выполнен расчет чистой приведенной стоимости по данным таблицы (рис. 5).

–ис. 5. Ќажатие кнопки "–асчет NPV"
7. Ќажмем на кнопку Ђƒиаграммаї. ¬ результате будет создана диаграмма на рабочем листе Ђƒиаграммаї (рис. 6).

–ис. 6. Ќажатие кнопки "ƒиаграмма"

