


Пример расчетной матрицы двухуровневого двухфакторного эксперимента представлен на рисунке 2.1.
Для ввода уравнения, для которого необходимо произвести расчет коэффициентов, необходимо перейти из раздела «Basic Statistics/Tables» в раздел

| «Multiple Regression» и открыть окно «Function to be estimated & loss function» Модель первого порядка (линейная модель) для двухфакторного эксперимента имеет следующий вид: |
| Рисунок 2.1 |
y=a0+a1*x1+a2*x2+a12*x1*x2.
После введения формулы на всех последующих окнах нужно просто нажимать «ОК», пока не появится окно-таблица «Model» с численными значениями коэффициентов модели. Для получения графического изображения

| функциональной зависимости в окне «Results» нажмите на «Fitted 3D function & observed vals». На рисунке 2.2 представлен график зависимости (поверхность отклика) показателя качества Y от факторов Х1 и Х2. |
| Рисунок 2.2 |
Для получения двухмерного сечения имеющейся поверхности отклика необходимо установить курсор в чистой зоне окна-графика «Model» и щелкнуть левой клавишей мышки два раза. В появившемся окне (рисунок 2.3), пользуясь полосой прокрутки в поле «Graph type», выберите «Contour plot» и нажмите «OK». Полученный в результате график, представленный на рисунке 2.4, и есть двухмерное сечение поверхности отклика исследуемого показателя качества Y.
Если качество исследуемого процесса, соединения и т.п. оценивается несколькими критериями оптимизации (показателями качества Y1, Y2 и т.д.), то для отыскания области оптимума необходимо решение компромиссной задачи, которое основано на использовании графического способа. Этот способ заключается в совмещении двухмерных сечений поверхностей отклика различных критериев оптимизации (показателей качества) для одного объекта исследований и визуальном выборе оптимальных условий проведения эксперимента.

| Совмещение (накладывание друг на друга) сечений поверхностей отклика различных критериев оптимизации можно производить с помощью стандартной программы «Paint». Для этого необходимо поочередно скопировать полученные сечения поверхностей отклика критериев оптимизации и вставить в файл программы «Paint», редактируя рисунки и совмещая оси Х1 и Х2 (на панели с набором инструментов при этом должен быть установлен режим прозрачного фона). | |||
| Рисунок 2.3 | ||||
| Определение регрессионной двухфакторной модели второго порядка. В раздел «Basic Statistics/Tables» вводим расчетную матрицу полного факторного эксперимента (например, трехуровневого двухфакторного эксперимента – 23). Для этого используем наиболее известную матрицу Коно, имеющую хорошие статистические характеристики и | 
| |||
| Рисунок 2.4 | ||||

| включающую небольшое число опытов. Пример расчетной матрицы трехуровневого двухфакторного эксперимента представлен на рисунке 4.5. Модель второго порядка для двухфакторного эксперимента имеет следующий вид: | |||
| Рисунок 2.5 | ||||
y=a0+a1*x1+a2*x2+a12*x1*x2+а11*х1*х1+а22*х2*х2.
Для получения окончательного вида уравнения необходимо исключить незначимые коэффициенты. Если незначимых коэффициентов будет несколько, то необходимо их удалять последовательно по одному, начиная с того, p-level-уровень которого наибольший, и каждый раз заново пересчитывать, пока не останутся только значимые.
Microsoft Excel
Табличный процессор MS Excel позволяет:
· Решать математические задачи: выполнять разнообразные табличные вычисления, вычислять значения функций, строить графики и диаграммы и т.п.
· Осуществлять численное исследование (Что будет, если? Как сделать, чтобы?).
· Проводить статистический анализ.
· Реализовать функции базы данных - ввод, поиск, сортировку, фильтрацию (отбор) и анализ данных.
· Устанавливать защиту на отдельные фрагменты таблицы, делать их невидимыми.
· Наглядно представлять данные в виде диаграмм и графиков.
· Вводить и редактировать тексты.
· Осуществлять обмен данными с другими программами, например, вставлять текст, рисунки, таблицы, подготовленные в других приложениях.
· Осуществлять многотабличные связи [4,5].
В Microsoft Excel применяются различные функции: совместимости, кубов, для работы с базами данных, даты и времени, инженерные функции, финансовые функции, информационные функции, логические функции, функции ссылки и поиска, математические и тригонометрические функции, статистические функции, текстовые функции, пользовательские функции, устанавливаемые вместе с надстройками.[4]
Microsoft Excel использовала для выполнения априорного ранжирования и построения диаграмм значимости факторов.
Априорное ранжирование – это психологический эксперимент, основанный на обобщении независимых субъективных мнений экспертов [6-8]. Эксперты – специалисты со стажем научной или практической работы, их количество рассчитывается по формуле, но должно быть не менее 7–10 чел. Цель ранжирования – установление значимости факторов и сокращение их числа за счёт отсева незначимых.
Экспертный опрос проводится в несколько этапов:
1) подготовительный (постановка задачи, подготовка анкет);
2) проведение опроса, заполнение анкет;
3) обработка анкет;
4) проверка адекватности матриц;
5) проверка согласованности мнений экспертов;
6) построение гистограммы рангов.
К анкетам предъявляется ряд требований:
• для каждого эксперта оформляется на отдельной странице;
• должны включать максимум встречающихся факторов;
• расположение факторов в предлагаемом перечне – хаотично;
• пояснения должны быть чёткими, особенно это касается
назначения рангов (1 – наиболее значимый, или наоборот);
• анкета должна быть простой по форме, например: ________________________________________________________
Анкета для экспертного опроса специалистов по теме:
«Показатели оценки качество клеевых пакетов переда мужских пиджаков»
| № п/п | Обозначение показателя | Наименование показателя | Ранг показателя |
| 1 | Х1 | Жёсткость при изгибе | |
| 2 | Х2 | Усадка от дублирования | |
| 3 | Х3 | Прочность на расслаивание | |
| 4 | Х4 | Формоустойчивость | |
| 5 | Х5 | Стойкость к химчистке | |
| 6 | Х6 | Воздухопроницаемость | |
| 7 | Х7 | Стойкость к истиранию |
После обработки анкет составляется первоначальная матрица рангов (таблица 3.1).
Таблица 3.1 – Первоначальная матрица рангов
| № эксперта, m j | Ранги по показателям, Ki | Сумма рангов | ||||||
| Х1 | Х2 | Х3 | Х4 | Х5 | Х6 | Х7 | ||
| Σ аij | ||||||||
| Qj (1) |
При наличии «связанных рангов» рассчитывается переформированная матрица рангов (таблица 3.2).
Таблица 3.2 – Переформированная матрица рангов
| № эксперта, m j | Ранги по показателям, Ki | Σ рангов | Тj | ||||||
| Х1 | Х2 | Х3 | Х4 | Х5 | Х6 | Х7 | |||
| 3,5 | 3,5 | 6,5 | 6,5 | ||||||
| 3,5 | 3,5 | 1,5 | 1,5 | ||||||
| 3,5 | 3,5 | 0,5 | |||||||
| 3,5 | 3,5 | 0,5 | |||||||
| 1,5 | 1,5 | 3,5 | 3,5 | ||||||
| 5,5 | 3,5 | 3,5 | 5,5 | ||||||
| 5,5 | 3,5 | 3,5 | 5,5 | ||||||
| 1,5 | 4,5 | 1,5 | 4,5 | ||||||
| 3,5 | 3,5 | 6,5 | 6,5 | ||||||
| Σ аij | 17,5 | 16,5 | 37,5 | 34,5 | |||||
| Qj (2) | |||||||||
| ∆j | 22,5 | -5 | 23,5 | 2,5 | 5,5 | -20 | -29 | ||
| ∆2j | 506,25 | 552,25 | 6,25 | 30,25 |
Обработка переформированной матрицы состоит в следующем [6 – 9]:
· расчёт суммы рангов по каждому эксперту и по каждому показателю (суммы рангов по вертикали и горизонтали должны совпадать);
· расчёт поправки на «связанные ранги» по формуле
 ,
,
где ti – число одинаковых рангов в i- й группе показателей;
u – число групп «связанных рангов»;
· определение места каждого показателя θj;
· расчет средней суммы рангов (отношение суммы рангов к количеству показателей);
· расчет отклонения суммы рангов по каждому показателю от средней суммы рангов 
 i;
i;
· расчёт квадрата отклонений  i 2 по каждому показателю.
Например, для эксперта № 1 
Адекватность первоначальной и переформированной матриц проверяется по критерию ранговой корреляции Спирмена:
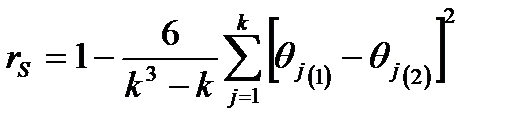 ,
,
где k – число показателей.
При rs = 1 ранжировки полностью совпадают,
при rs = –1 – полностью противоположны,
при r s = 0 между ними нет никакого соответствия,
при значениях 0 < rs < 1 необходимо проверить значимость.
В примере
 .
.  = 0,89. Статистическую значимость критерия ранговой корреляции Спирмена оценивают по критерию Стьюдента, наблюдаемое значение которого определяется по формуле
 .
.
Критерий Спирмена считается значимым, если расчётное значение критерия Стьюдента не превышает табличное
Поскольку в примере критерий Спирмена  , т.е. близок к 1, то его статистическую значимость по критерию Стьюдента t проверять не нужно. Адекватность матриц очевидна.
Гипотезу о наличии согласия экспертов проверяют с помощью коэффициента конкордации Кендэла:
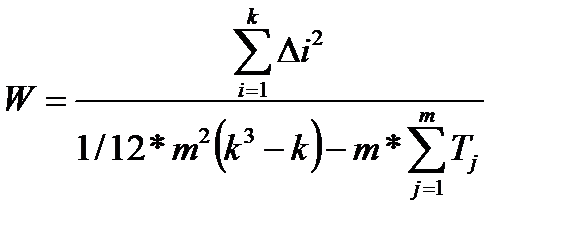 ,
,
где m –число экспертов.При W = 1,0 – согласие полное, при W < 0,37 – отсутствует, при W  0,375 – необходимо проверить его значимость.
Значимость коэффициента конкордации оценивают по критерию Пирсона:
 .
.
При  гипотеза о наличии согласия мнений экспертов принимается.Расчётное значение критерия Пирсона значительно превышает табличное (12,59), поэтому согласие экспертов подтверждается.
Анализ результатов экспертного опроса проводят с помощью гистограмм – столбчатых диаграмм. Для традиционного восприятия «чем выше, тем лучше» вертикальную ось в гистограмме рангов направляют сверху вниз, чтобы наиболее значимые факторы (сумма рангов которых минимальна) были графически выше незначимых. На рисунке 3.1 представлена матрица рангов и диаграмма выполненная в Microsoft Excel
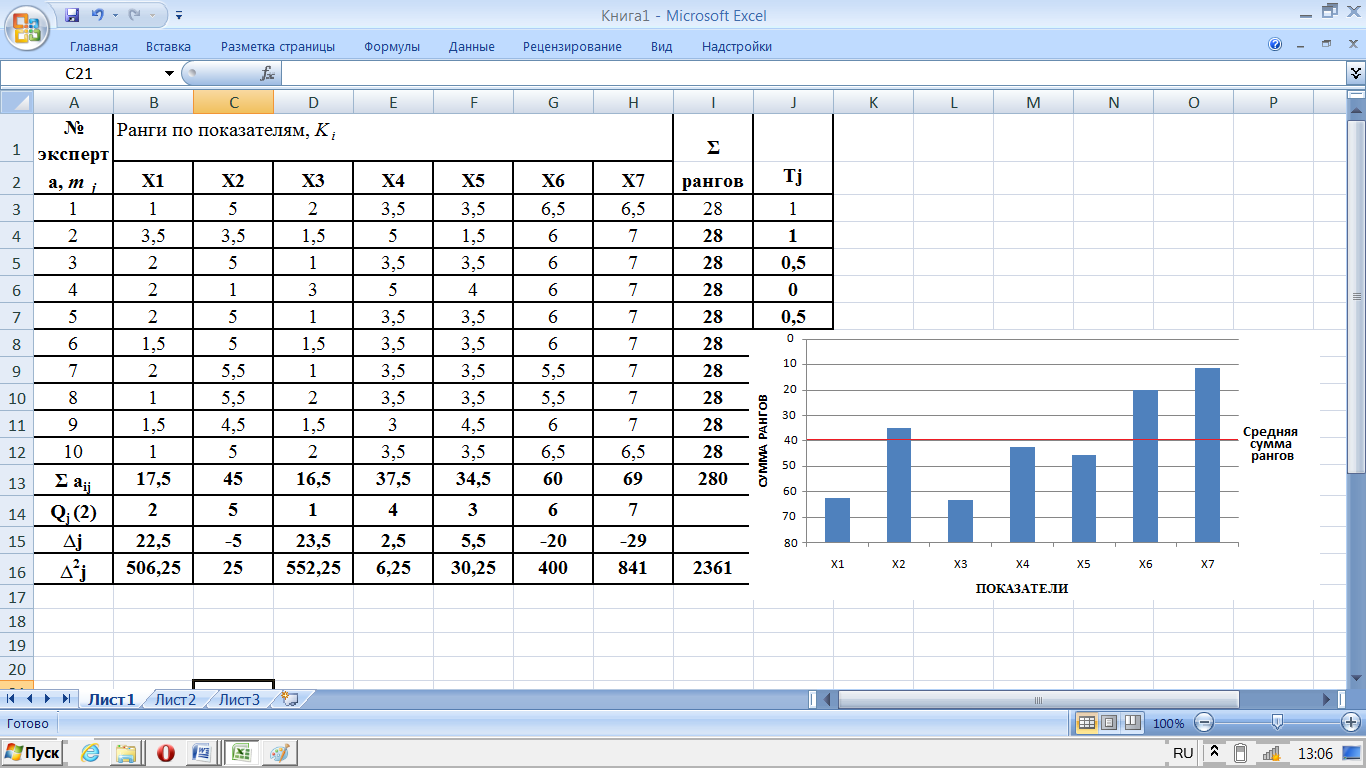
Рисунок 3.1
По гистограмме рангов делаются следующие выводы:
• факторы с суммой рангов выше линии средней суммы рангов являются значимыми;
• факторы с суммой рангов ниже линии средней суммы рангов
являются незначимыми, ими можно пренебречь;
• самый значимый фактор (с наименьшей суммой рангов)
является основным в будущем эксперименте.
Maple.
Maple - программный пакет, система компьютерной алгебры. Создана в компании Waterloo Maple Inc., которая основана в 1984 году и выпускает и продвигает на рынке ряд программных продуктов, ориентированных на сложные математические вычисления, визуализацию данных и моделирование. Система Maple предназначена для символьных вычислений, хотя имеет ряд средств и для численного решения дифференциальных уравнений и нахождения интегралов. Обладает развитыми графическими средствами. Имеет собственный язык программирования [10].
Задачи, наиболее часто встречаемые при экономико-математическом моделировании:
· Матрицы.
· Дифференциальное исчисление.
· Интегрирование.
· Решение задач линейного программирования с помощью программы Maple.
· Примеры решения транспортных задач в Maple.
Несомненными плюсами использования Maple являются:
· Значительное сокращение затрат времени на поиск решения задач.
· Обеспечение необходимой наглядности информации.
· Возможность быстрой корректировки введенных данных.
· Снижение возможности совершить ошибку в решении задач.
· Постоянное обновление и программного обеспечения.
В дальнейшем развитее программного обсечения приведёт к тому, что математические пакеты программ будут использоваться не только для выполнения отдельных, наиболее трудоемких операций обработки данных, но и на всех этапах решения задач по ЭММ [11].
Статистические функции
Пакет stats представлен всего двумя многоцелевыми статистическими функциями:
stats[subpackage, functionj(args) и subpackage[function](args)
Однако благодаря специальной форме задания параметров (в частности, в виде подпакетов — subpackages) возможно вычисление самых разнообразных статистических функций. Имеются следующие подпакеты:
anova — вариационный анализ; describe — функции распределения вероятности; fit — регрессионный анализ; random — генерация случайных чисел с различными законами распределения; statevalf — вычисление статистических функций и получение оценок для массивов данных; statplots — построение графиков статистических функций; transform — функции преобразования данных.
Статистический пакет stats имеет свою небольшую библиотечку для построения графиков. Она вызывается в следующем виде: stats[statplots, function](args) или statplots[function](args). Вид графика задается описанием function: boxplot, histogram, notehedbox, quantile, quantile2, scatterld, scatter2d и symmetry. Данные функции обеспечивают построение типовых графиков, иллюстрирующих статистические расчеты.
Для визуализации вычислений используется построение гистограмм. Для их создания пакет stats имеет функцию histogram: stats[statplotsбhistogram](data): или statplots[h1stogram](data)илиstats[statplots,histogram[scale](data) или statp1ots [histogram[scale](data). Здесь data - список данных, scale — число или описатель.
Для проведения регрессионного анализа служит функция fit, которая вызывается следующим образом: stats[fit,leastsquare[vars,eqn.parms]](data) или fit[leastsquare[vars,eqn.parms]](data), где data — список данных, vars — список переменных для представления данных, eqn — уравнение, задающее аппроксимирующую зависимость (по умолчанию линейную), parms — множество параметров, которые будут заменены вычисленными значениями. Функция fit неприменима для нелинейной регрессии. При попытке ее проведения возвращается структура процедуры, но не результат регрессии.
САПР
Система автоматизации проектных работ (САПР) или CAD - программный пакет, предназначенный для проектирования (разработки) объектов производства (или строительства), а также оформления конструкторской и/или технологической документации. Выделяют следующие виды обеспечения:
-математическое обеспечение САПР — математические модели, методики и способы их получения;
-лингвистическое обеспечение САПР;
-техническое обеспечение САПР — устройства ввода, обработки и вывода данных, средства поддержки архива проектных решений, устройства передачи данных;
-информационное обеспечение САПР — информационная база САПР, автоматизированные банки данных, системы управления базами данных (СУБД);
-программное обеспечение САПР;
-программные компоненты САПР (примером может служить Геометрический решатель САПР);
-методическое обеспечение;
-организационное обеспечение.
САПР используется в работе конструкторов и технологов, связанных с разработкой чертежей, схем, диаграмм, то есть с обработкой графических изображений.
Опыт автоматизации проектных работ позволил установить, что автоматизация целесообразна в тех отраслях народного хозяйства, где быстрота сменяемости изготовляемых моделей и изделий заставляет вести проектные работы в сжатые сроки. К таким отраслям относится и швейная промышленность. В связи с расширением ассортимента выпускаемой продукции и появлением новых материалов, оборудования, спецприспособлений становится все более сложным выполнение всех проектных работ по подготовке производства новых моделей за счет простого увеличения числа инженеров. Необходимо качественно изменить их труд, поручить средствам автоматизации основную массу выполняемых работ.
В швейной промышленности занялись вопросами автоматизации проектирования значительно позже других отраслей (в середине 70-х годов), однако уже сегодня достигнуты значительные результаты. На ряде швейных предприятий внедрены разработки по автоматизации конструкторской и технологической подготовки производства. Среди них следующие подсистемы:
· расчета и преобразований базовых конструкций одежды;
· получения конструкторской документации на новую модель
одежды, включая градацию лекал;
· проектирования технологических процессов изготовления швейных изделий;
· расчета кусков материала;
· выполнения раскладок и нормирования расхода материалов и др.
Все программные модули, входящие в промышленную САПР, предусматривают работу на достаточно мощном миникомпьютере и на так называемых рабочих станциях, действующих в определенной операционной среде. Используются технические средства ввода и вывода графической информации.[12 ]
Сервер состоит из трех блоков (частей):
• системного блока, включающего блок питания, электронные схемы, накопители: (или дисководы) для гибких магнитных дисков, накопитель на жестком магнитном диске (винчестер);
• клавиатуры, позволяющей вводить символы в компьютер;
• монитора (или дисплея) – для изображения текстовой и графической информации.
К системному блоку компьютера (серверу) могут быть подключены различные устройства ввода-вывода информации, которые являются внешними. Кроме монитора и клавиатуры такими устройствами являются:
• принтер формата А4 – для вывода на печать текстовой и графической информации;
• мышь – устройство, облегчающее ввод информации в компьютер;
• дигитайзер – устройство для ввода графической информации;
• плоттер – устройство для вывода графической информации.
Кроме того, в системе автоматизированного проектирования используются во внешнем исполнении такие устройства, как стример для записи данных на магнитную ленту, и модем – для обмена информацией с другими компьютерами через телефонную связь. На рисунке 4.1 представлен дигитайзер.

Рисунок 4.1
Лекала закрепляются на рабочей плоскости дигитайзера липкой лентой в произвольном порядке, но желательно учитывать ворс или направленный рисунок, если он имеется (что бы конструктор не тратил время на перевороты)
 На рисунке 4.2 представлен внешний вид экрана дисплея для получения раскладок в модуле РАСКЛАДКА (GERBER).
Рисунок 4.2
Создание САПР характеризует новое научно-техническое направление в проектировании и определяет более высокий уровень применения вычислительной техники, чем только использование ЭВМ для решения отдельных проектных задач. Развитие систем автоматизированного проектирования приведет к созданию новых теорий и методов, учитывающих необходимость математического моделирования объектов проектирования. Изменение организационно-технического уровня проектирования, несомненно, приведет к улучшению качества продукции.
Заключение
Подводя итоги проведённой работе, можно сделать вывод о том, что применение информационных технологий в исследованиях имеет большое значение. Данные технологии позволяют поднять исследования в этих областях на качественно новый уровень.
Также в данной работе были рассмотрены практические примеры использования информационных технологий. Из всего вышесказанного можно сделать вывод о необходимости широкого применения информационных технологий в научных исследованиях [2].
Литература
1.Информационные технологии в экономике [Электронный ресурс]. – Режим доступа: http://student.zoomru.ru/ekonom/informacionnye-tehnologii-v-jekonomike/176052.1479431.s4.html. - Дата доступа: 23.12.2013.
2.Использование информационных технологий в изучении истории Белорусского Государственного Университета - [Электронный ресурс]. – Режим доступа: http://rudocs.exdat.com/docs/index-98358.htm. - Дата доступа: 23.12.2013.
3.Ящерицын, П. И. Планирование эксперимента в машиностроении / П. И. Ящерицын, Е. И. Махаринский. – Минск: Вышэйшая школа, 1985. – 285 с.
4. Microsoft Excel [Электронный ресурс]. – Режим доступа: http://ru.wikipedia.org/wiki/Microsoft_Excel. - Дата доступа: 24.12.2013.
5. Возможности Microsoft Excel [Электронный ресурс]. – Режим доступа: http://otherreferats.allbest.ru/programming/00028176_0.html. - Дата доступа: 24.12.2013.
6. Тихомиров, В. Б. Планирование и анализ эксперимента / В. Б. Тихомиров. – Москва: Лёгкая индустрия, 1974. – 262 с.
7. Большакова, И. К. Свойства прокладочных и прикладных материалов и комплектование их в пакетах верхней одежды / И. К. Большакова, О. Н. Калина, Н. В. Цаценко // Швейная промышленность. Обзорная информация. – 1989. – Вып.1. – 56 с.
8. Гарская, Н. П. Разработка экспресс-метода оценки качества пакетов полочек мужской верхней одежды / Н. П. Гарская, Р. Н. Филимоненкова, Е. Х. Меликов // Известия ВУЗов. Технология лёгкой промышленности. – 1991. – №1. – С. 68-71.
9. Основы научных исследований: конспект лекций для студентов специальности 50 01 02 «Конструирование и технология швейных изделий» дневной и заочной форм обучения / УО «ВГТУ»; сост. Н. П. Гарская. – Витебск: ВГТУ, 2003. – 42 с.
10. Maple [Электронный ресурс]. – Режим доступа: http://ru.wikipedia.org/wiki/Maple. - Дата доступа: 24.12.2013.
11. Задачи, решаемые Maple [Электронный ресурс]. – Режим доступа: http://otherreferats.allbest.ru/emodel/00109873_0.html. - Дата доступа: 24.12.2013.
12. Короткова, И. В. Обзор швейных САПР (возникновение и развитие) / И. В. Короткова, С. В. Мелкова // Швейная промышленность. – 2002. – №5. – С.40-42.

