


Лабораторная работа № 3
Построение регрессионной модели системы двух случайных величин
Цель работы: изучить основные методы регрессионного и корреляционного анализа; исследовать зависимость между двумя случайными величинами, заданными выборками.
Задание: по виду корреляционного поля сделать предположение о форме регрессионной зависимости между двумя случайными величинами; используя метод наименьших квадратов, найти параметры уравнения регрессии; оценить качество описания зависимости полученным уравнением регрессии.
Пример. По результатам пятнадцати совместных измерений веса грузового поезда, т, и соответствующего времени нахождения поезда на участке Y, ч, представленных в таблице 4.3, следует исследовать зависимость между данными величинами.
Необходимо определить коэффициенты уравнения регрессии методом наименьших квадратов, оценить тесноту связи между величинами, проверить значимость коэффициента корреляции и спрогнозировать время нахождения поезда на участке при заданном весе поезда (5200 т).
Решение. На величину времени нахождения поезда на участке Y, помимо веса X, влияние оказывает качество железнодорожного полотна, качество подвижного состава, топливо и другие факторы. Поэтому зависимость между величиной времени нахождения поезда на участке Y и веса поезда X является статистической: при одном весе поезда при различных дополнительных условиях время нахождения поезда на участке может принимать различные значения.
Для определения вида регрессионной зависимости построим корреляционное поле.

Рисунок 4.1– Корреляционное поле
Построение линейной модели
Характер расположения точек на диаграмме рассеяния позволяет сделать предположение о линейной регрессионной зависимости  .
.
Таблица 3.1 – Результаты промежуточных вычислений
Вес грузового состава, т, 
| Время нахождения поезда на участке, час., 
| 
| 
| 
| 
| 
|
| 5100,58 | 4,2 | 327,019 | 106941,2 | 0,14007 | 0,01962 | 45,8044 |
| 4885,41 | 4,078 | 111,849 | 12510,12 | 0,01807 | 0,00033 | 2,02073 |
| 5416,94 | 4,23 | 643,379 | 413936,1 | 0,17007 | 0,02892 | 109,417 |
| 4496,66 | 4,001 | -276,901 | 76674,35 | -0,0589 | 0,00347 | 16,3187 |
| 4722,08 | 4,044 | -51,4813 | 2650,328 | -0,0159 | 0,00025 | 0,82027 |
| 5537,91 | 4,208 | 764,349 | 584228,9 | 0,14807 | 0,02192 | 113,175 |
| 5074,01 | 4,11 | 300,449 | 90269,4 | 0,05007 | 0,00251 | 15,0425 |
| 4807,09 | 4,062 | 33,5287 | 1124,171 | 0,00207 | 0,000043 | 0,06929 |
| 4046,02 | 3,85 | -727,541 | 529316,4 | -0,2099 | 0,04407 | 152,735 |
| 4683,93 | 4,037 | -89,6313 | 8033,776 | -0,0229 | 0,00053 | 2,05555 |
| 4872,42 | 4,08 | 98,8587 | 9773,036 | 0,02007 | 0,0004 | 1,98376 |
| 4003,22 | 3,9 | -770,341 | 593425,8 | -0,1599 | 0,02558 | 123,203 |
| 4628,01 | 4,03 | -145,551 | 21185,19 | -0,0299 | 0,0009 | 4,35684 |
| 4293,44 | 3,96 | -480,121 | 230516,5 | -0,0999 | 0,00999 | 47,9801 |
| 5035,7 | 4,109 | 262,139 | 68716,68 | 0,04907 | 0,00241 | 12,8623 |
| Итого 71603,42 | 60,899 | 0,1609 | 647,845 |
Найдем уравнение прямой линии методом наименьших квадратов .
Средний вес грузового состава:
 =
=  .
.
Среднее значение времени нахождения поезда на участке:
 =
= 
Коэффициенты уравнения:
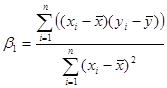


Уравнение регрессии имеет вид:  .
.
Для линейной связи коэффициенты:
 - постоянная регрессии, показывает точку пересечения прямой с осью ординат
 - коэффициент регрессии, показывает меру зависимости переменных y от х, указывает среднюю величину изменения переменной у при изменении х на одну единицу, знак В1 определяет направление этого изменения.
Вычислим линейный коэффициент корреляции
 =
=  .
.
Таблица 3.2 – Расчет значений времени нахождения поезда на участке по уравнению регрессии
| Вес грузового состава, т,
| Время нахождения поезда на участке, час.,
| 
|
| 5100,58 | 4,2 | 4,137 |
| 4885,41 | 4,078 | 4,0863 |
| 5416,94 | 4,23 | 4,2115 |
| 4496,66 | 4,001 | 3,9947 |
| 4722,08 | 4,044 | 4,0478 |
| 5537,91 | 4,208 | 4,24 |
| 5074,01 | 4,11 | 4,1307 |
| 4807,09 | 4,062 | 4,0678 |
| 4046,02 | 3,85 | 3,8885 |
| 4683,93 | 4,037 | 4,0388 |
| 4872,42 | 4,08 | 4,0832 |
| 4003,22 | 3,9 | 3,8784 |
| 4628,01 | 4,03 | 4,0256 |
| 4293,44 | 3,96 | 3,9468 |
| 5035,7 | 4,109 | 4,1217 |
| Итого 71603,42 | 60,899 | 60,899 |

Рисунок 3.2 – Корреляционное поле и линия регрессии
Спрогнозируем время нахождения поезда на участке при заданном весе грузового состава (5200 т).

Качественная оценка тесноты связи между величинами выявлена по шкале Чеддока (таблица 3.3).
Таблица 3.3 - Шкала Чеддока
| Теснота связи | Значение коэффициента корреляции при наличии | |
| прямой связи | обратной связи | |
| Слабая | 0,1–0,3 | (-0,1)–(-0,3) |
| Умеренная | 0,3–0,5 | (-0,3)–(-0,5) |
| Заметная | 0,5–0,7 | (-0,5)–(-0,7) |
| Высокая | 0,7–0,9 | (-0,7)–(-0,9) |
| Весьма высокая | 0,9–0,99 | (-0,9)–(-0,99) |
Multiple Regression - Col_2
Dependent variable: Col_2
Independent variables:
Col_1
| Standard | T | |||
| Parameter | Estimate | Error | Statistic | P-Value |
| CONSTANT | 2,93509 | 0,0727762 | 40,3304 | 0,0000 |
| Col_1 | 0,00023564 | 0,0000151847 | 15,5182 | 0,0000 |
Analysis of Variance
| Source | Sum of Squares | Df | Mean Square | F-Ratio | P-Value |
| Model | 0,152658 | 0,152658 | 240,81 | 0,0000 | |
| Residual | 0,008241 | 0,000633923 | |||
| Total (Corr.) | 0,160899 |
R-squared = 94,8782 percent
R-squared (adjusted for d.f.) = 94,4842 percent
Standard Error of Est. = 0,0251778
Mean absolute error = 0,0169255
Durbin-Watson statistic = 1,36787 (P=0,0913)
Lag 1 residual autocorrelation = 0,0654037
The StatAdvisor
The output shows the results of fitting a multiple linear regression model to describe the relationship between Col_2 and 1 independent variables. The equation of the fitted model is
Col_2 = 2,93509 + 0,00023564*Col_1
Since the P-value in the ANOVA table is less than 0,05, there is a statistically significant relationship between the variables at the 95,0% confidence level.


Вывод. Линейный коэффициент корреляции характеризует тесноту связи между двумя коррелируемыми признаками в случае наличия между ними линейной зависимости. Т.к.  = 0,974, то можно говорить о том, что между величинами X и Y существует линейная прямая, весьма высокая связь.
Чтобы сделать статистический вывод о значимости коэффициента корреляции (при проверке линейности регрессионной зависимости) выдвигается нулевая гипотеза об отсутствии линейной зависимости между исследуемыми с. в. против альтернативной гипотезы о наличии линейной связи.
 ,
,
 .
.
Если гипотеза H 0отклоняется, то считается, что уравнение регрессии Y по X действительно имеет линейный вид.
Для проверки гипотезы H 0 вычисляется t -статистика
 =
= 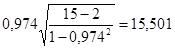 .
.
При условии справедливости гипотезы H 0 рассчитанная t -статистика имеет распределение Стьюдента с n – 2 степенями свободы. Найденное значение t = 15,501сравнивается с критическим значением t a,n при n = n – 2 = 15-2 = 13 степенях свободы (приложение А). В нашем случае t a,n = t a=0.05, n=13 = 1,771. Так как расчетное значение 15,501по абсолютной величине превосходит табличное 1,771 для заданного уровня значимости, то нулевая гипотеза H 0 о линейной независимости двух с. в. отклоняется.
Задание для факультета ПГС для лабораторной работы 3

