Задача (образец)
Пусть по 10 однотипным предприятиям имеются следующие данные о выпуске продукции (х) в тыс. ед. и о расходе условного топлива (у) в тоннах (графы 1 и 2 таблицы).
Требуется найти уравнение зависимости расхода топлива от выпуска продукции (или уравнение регрессии у по х) и измерить тесноту зависимости между ними.
Решение.
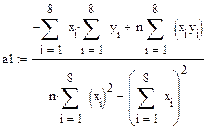
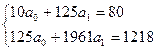
А. Рассматривая уравнение регрессии в форме линейной функции вида  , параметры данного уравнения (
 и
и  ) найдем из системы нормальных уравнений
| x
| y
| X2
| xy
| 
| Y2
|
|
|
|
|
|
|
|
|
|
|
|
| 3,9
|
|
|
|
|
|
| 4,4
|
|
|
|
|
|
| 5,5
|
|
|
|
|
|
| 5,5
|
|
|
|
|
|
| 6,6
|
|
|
|
|
|
| 6,6
|
|
|
|
|
|
| 8,8
|
|
|
|
|
|
| 12,1
|
|
|
|
|
|
| 12,1
|
|
|
|
|
|
| 14,3
|
|
|
|
|
|
| 80 (округл 79,8)
|
|
Необходимые для решения суммы  ,
,  ,
,  ,
,  рассчитаны выше в таблице. Подставляем их в уравнения и решаем систему:
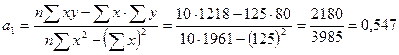
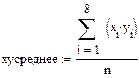
 Отсюда .
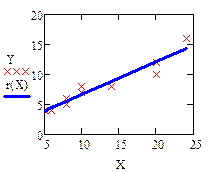
Подставляя в это уравнение последовательно значения х — 5, 6, 8, 10 и т.д., получаем выровненные (теоретические) значения результативного показателя  (графа 5 таблицы).
Поскольку параметры уравнения регрессии являются оценочными, то для каждого из них рассчитывается средняя ошибка, т.е.  .
.
Конкретный расчет ошибок для  и , по данным нашего примера приведен далее (см. с. 83).
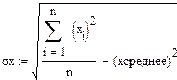
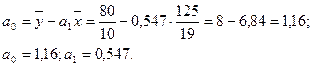
Б. Для измерения тесноты зависимости между 'у и ос воспользуемся прежде всего линейным коэффициентом корреляции (поскольку зависимость рассматривалась линейной):
а) применяем формулу  Находим


 . Определяем
  и
и  , предварительно найдя
  и
и 

 Отсюда
  .
.
Значение линейного коэффициента корреляции r = 0,96 (т.е. близкое к единице) характеризует не только меру тесноты зависимости вариации у от вариации х, но и степень близости этой зависимости к линейной;
Задача 1.
Имеются следующие данные по 8 сахарным заводам о стоимости основных фондов, (x млн. руб.) и суточной переработке сахарной свеклы, y (тыс. т.):

|
| 2,3
| 2.4
| 2.9
| 2.9
| 3.7
| 3.7
| 4.1
|

| 8,9
|
| 9.9
| 10.3
|
|
| 12.8
| 13.1
|
Найти уравнение регрессии y по x и коэффициент корреляции и построить графики. Решить в mathcad.
Задача 2. По данным 10 предприятий с помощью с помощью коэффициентов корреляции измерить тесноту зависимости между объемом выпуска продукции (y) млн. руб. и стоимостью основных производственных фондов (x) млн. руб. и определить уравнение регрессии коэффициент корреляции.
|
| 1,5
| 1,8
| 2,0
| 2,2
| 2,3
| 2,6
| 3,0
| 3,1
| 3,5
| 3,8
|
|
| 3,9
| 4,4
| 3,8
| 3,5
| 4,8
| 4,3
| 7,0
| 6,5
| 6,1
| 8,2
|
Задача образец.
Задача 1. пусть по 10 однотипным предприятиям имеются следующие данные о выпуске продукции ( ) в тыс. ед. и расходе условно топлива (
 ) в тоннах. Требуется найти уравнение зависимости расходов топлива от выпуска продукции (или уравнение регрессии) и измерить тесноту зависимости между ними (коэффициент корреляции).
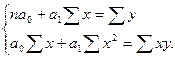
| среднее квадратическое отклонение по X и по Y
|
| коэффициенты уравнения регрессиии
|
Определение уравнения нелинейной регрессии и индекса корреляции, определяющего тесноту связи между двумя переменными.
Задача 4.
По данным таблицы (1) исследовать зависимость урожайности зерновых культур  от количества осадков
  и построить квадратичную регрессионную функцию.
Таблица 1.
|
|
|
|
|
|
|
|
|
|
|
|
|
|
|
|
|
Количество осадков,  , см. , см.
|
|
|
|
|
|
|
|
|
|
|
|
|
|
|
|
Урожайность
(ц/га), 
|
|
|
|
|
|
|
|
|
|
|
|
|
|
|
|
Решить эту задачу в mathcad.
| 1. Определите количество переменных i, vxi и vyi.
|

| 2. Запишите вектор regress(vx,vy,k), который
в дальнейшем используем для определения
коэффициентов уравнения.
|
| 3. Запишите коэффициент coeffs, где
length(z) определяет длину вектора z.
|
| 4. Запишите обратный вектор coeffsT, из которого
определяем коээфициенты уравнения регрессии.
|
| 5. Постройте график, на котором будут две кривые,
эспериментальные данные изобразите в виде меток
(квадратиков или крестиков), теоретические - в виде
линии.
|