


Диаграмма 2. РАСХОДЫ НА НИОКР В МИРЕ В 2008 г.
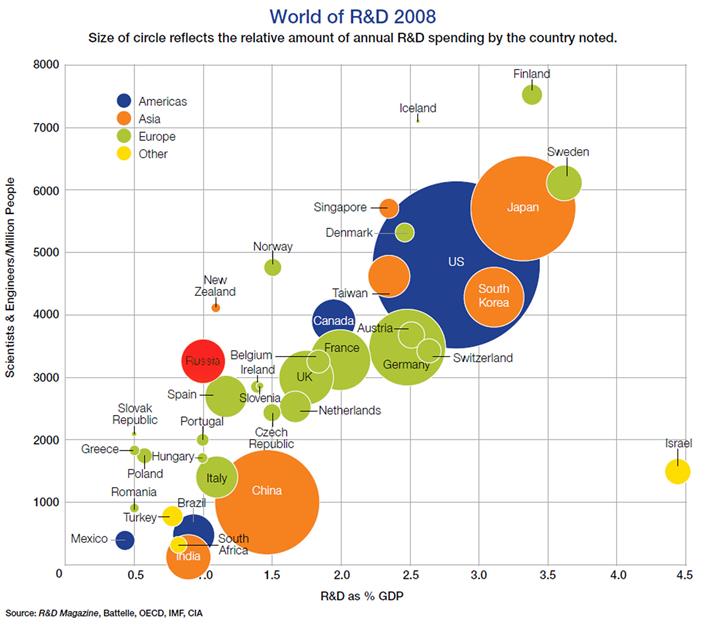
Источник: Global R&D Funding Forecast 2010 Battelle Magazine, p.4
Диаграмма 3. МИРОВОЙ ЭКСПОРТ И ИМПОРТ ТЕХНОЛОГИЙ В 2007 г.
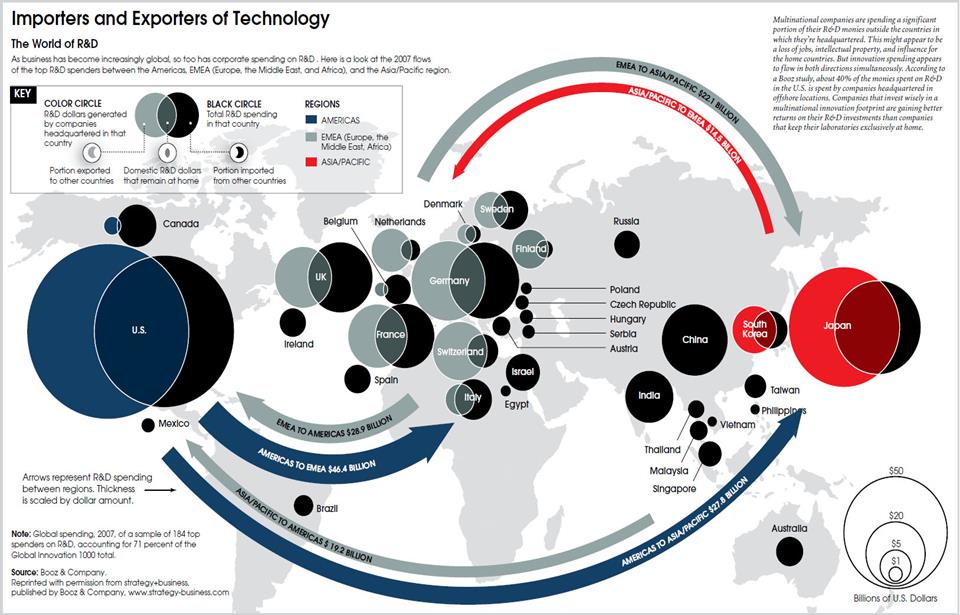
Источник: Global R&D Report 2008 Magazine, p. 20-21
Табл. 2. ЧИСЛЕННОСТЬ ПЕРСОНАЛА, ЗАНЯТОГО ИССЛЕДОВАНИЯМИ И РАЗРАБОТКАМИ В РОССИИ
(тысячи человек)
| Год | Персонал | исследователи | техники | вспомогательный персонал | прочие |
| 1 943,4 | 992.6 | 234,8 | 512,5 | 203,5 | |
| 1 061,0 | 518,7 | 101,4 | 274,9 | 166,0 | |
| 887,7 | 425,9 | 75,2 | 240,5 | 146,1 | |
| 813,2 | 391,1 | 66,0 | 215,6 | 140,5 | |
| 801,1 | 392,8 | 64,6 | 208,0 | 135,7 | |
| 761,2 | 375,8 | 60,2 | 194,7 | 130,4 |
Источники: Тенденции развития кадрового потенциала российской науки, Институт проблем развития науки РАН, Москва 2008, стр.7, Российский статистический ежегодник. 2009, Москва 2009. стр. 543.
Диаграмма 4. ПУБЛИКАЦИИ РОССИЙСКИХ АВТОРОВ В НАУЧНЫХ ЖУРНАЛАХ, ИНДЕКСИРУЕМЫХ В WEB OF SCIENCE
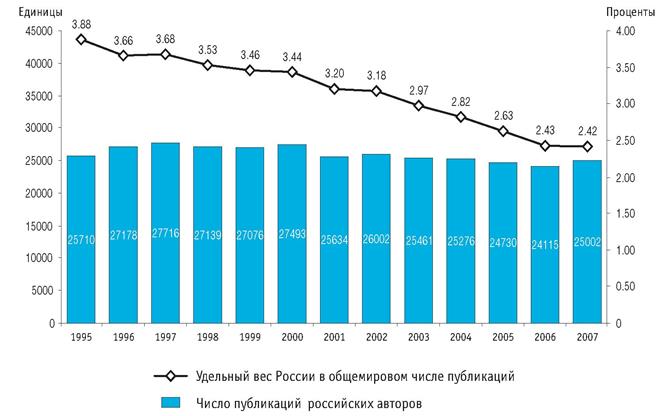
Источник: Индикаторы науки: 2009, стр. 231
Табл. 3. ДОЛЯ НАУЧНЫХ ПУБЛИКАЦИЙ УЧЁНЫХ РАЗЛИЧНЫХ СТРАН
2005 г.
| Доля в мировых расходах на НИОКР в 2008 г. (%) | Доля научных публикаций учёных различных стран, 2005 | |
| США | 34,0 | 28,9 |
| ЕС 27 | 25,9 | 33,1 |
| Япония | 13,0 | 7,8 |
| Китай | 11,1 | 5,9 |
| Южная Корея | 3,3 | 2,3 |
| Канада | 2,2 | 3,6 |
| Россия | 2,2 | 2,0 |
| Индия | 2,0 | 2,1 |
| Бразилия | 1,6 | 1,4 |
| Прочие | 15,2 | 25,6 |
Источник: 2009 R&D Funding Forecast, December 2008, стр.3,5; OECD Science, Technology and Industry: Outlook 2008
Табл. 4. СТРУКТУРА ПУБЛИКАЦИЙ РОССИЙСКИХ АВТОРОВ В НАУЧНЫХ ЖУРНАЛАХ, ИНДЕКСИРУЕМЫХ В WEB OF SCIENCE, ПО ОБЛАСТЯМ НАУКИ
2003–2007 гг. (проценты)
| Все страны мира | Россия | |
| Клиническая медицина | 20,5 | 4,8 |
| Химия | 12,3 | 22,3 |
| Физика | 9,5 | 27,7 |
| Технические науки | 8,2 | 8,1 |
| Биология и биохимия | 5,7 | 4,0 |
| Науки о растениях и животных | 5,6 | 2,5 |
| Материаловедение | 4,7 | 6,1 |
| Общественные науки | 4,1 | 1,0 |
| Компьютерные науки | 3,4 | 1,3 |
| Нейронауки и поведенческие науки | 3,1 | 0,8 |
| Науки о земле | 2,9 | 7,3 |
| Молекулярная биология и генетика | 2,8 | 2,2 |
| Науки об охране окружающей среды | 2,6 | 0,9 |
| Математика | 2,5 | 4,5 |
| Психиатрия и психология | 2,4 | 0,5 |
| Сельское хозяйство | 1,9 | 0,7 |
| Фармакология и токсикология | 1,8 | 0,2 |
| Микробиология | 1,7 | 1,3 |
| Экономика и бизнес | 1,5 | 0,1 |
| Иммунология | 1,3 | 0,2 |
| Науки о космосе | 1,2 | 3,3 |
| Мультидисциплинарные исследования | 0,2 | 0,1 |
Источник: Индикаторы науки: 2009, стр. 232
Табл. 5. ОБЩИЕ ВНУТРЕННИЕ РАСХОДЫ НА НИОКР В 2007 г.
| Доля финансирования | |||
| % от ВВП | Государство | Бизнес | |
| Швеция | 3,60 | 24,43 | 63,86 |
| Финляндия | 3,47 | 24,05 | 68,20 |
| Южная Корея | 3,47 | 24,80 | 73,65 |
| Япония | 3,44 | 15,63 | 77,71 |
| Швейцария | 2,90 | 22,71 | 69,73 |
| США | 2,68 | 27,73 | 66,44 |
| Дания | 2,55 | 27,58 | 59,53 |
| Германия | 2,54 | 27,76 | 68,07 |
| Большая семерка | 2,53 | 26,64 | 65,80 |
| ОЭСР | 2,29 | 28,56 | 63,79 |
| Франция | 2,08 | 38,42 | 52,44 |
| Австралия | 2,01 | 38,37 | 57,23 |
| Канада | 1,88 | 31,42 | 49,40 |
| Великобритания | 1,79 | 29,33 | 47,19 |
| ЕС 27 | 1,77 | 34,11 | 54,98 |
| Чехия | 1,54 | 41,19 | 53,96 |
| Китай | 1,49 | 24,62 | 70,37 |
| Испания | 1,27 | 42,49 | 47,07 |
| Италия | 1,13 | 48,32 | 40,42 |
| Россия | 1,12 | 62,62 | 29,45 |
| Бразилия | 1,02 | 57,88 | 39,38 |
| Индия | 0,71 | 80,81 | 16,11 |
Источник: OECD in Figures 2009. OECD Countries, 2007 Gross Domestic Expenditure on R&D
Табл. 6. ДОЛЯ ВЫСОКОТЕХНОЛОГИЧНОГО ЭКСПОРТА В ПРОМЫШЛЕННОМ ЭКСПОРТЕ
2007 г. (в %)
| Ирландия | 46,9 |
| Швейцария | 42,9 |
| Южная Корея | 33,0 |
| США | 32,9 |
| Китай | 32,8 |
| Венгрия | 31,9 |
| Нидерланды | 28,7 |
| Великобритания | 28,6 |
| Мексика | 28,4 |
| Израиль | 25,0 |
| БРИК | 24,6 |
| Япония | 23,1 |
| Франция | 22,8 |
| ОЭСР | 22,6 |
| Финляндия | 20,1 |
| ЕС 19 | 19,8 |
| Швеция | 19,2 |
| Дания | 19,0 |
| Германия | 18,8 |
| Индонезия | 9,1 |
| Бразилия | 8,3 |
| Индия | 5,8 |
| Россия | 2,3 |
Источник: OECD, STAN Indicators Database, 2009 edition. Underlying series from STAN Bilateral Trade Database.
Табл. 7. ГОСУДАРСТВЕННЫЕ АССИГНОВАНИЯ НА НИОКР в 2007 г.
| % от ВВП | Доля оборонных НИОКР в государственных расходах на НИОКР | |
| Испания | 1,08 | 13,1 |
| Португалия | 1,01 | 0,5 |
| США | 1,00 | 56,6 |
| Финляндия | 0,97 | 2,8 |
| Корея | 0,96 | 18,0 |
| Большая семерка | 0,87 | 38,6 |
| Дания | 0,85 | 0,6 |
| Швеция | 0,81 | 12,4 |
| Германия | 0,79 | 6,0 |
| ОЭСР | 0,78 | 32,9 |
| Франция | 0,75 | 27,7 |
| Швейцария | 0,72 | 0,6 |
| Япония | 0,70 | 5,2 |
| Нидерланды | 0,70 | 2,0 |
| ЕС 27 | 0,69 | 12,5 |
| Великобритания | 0,67 | 24,2 |
| Италия | 0,63 | 1,2 |
| Чехия | 0,61 | 2,3 |
| Канада | 0,57 | 4,0 |
| Ирландия | 0,55 | 0,0 |
| Бразилия | 0,53 | 1,2 |
| Австралия | 0,46 | 7,7 |
| Россия | 0,40 | 52,1 |
Источник: OECD in Figures 2009. OECD Countries, 2007 Gross Domestic Expenditure on R&D
Табл. 8. КОРПОРАЦИИ – МИРОВЫЕ ЛИДЕРЫ ПО ОБЪЁМУ ФИНАНСИРОВАНИЯ НИОКР
в 2008 г., млрд. долл. США
| Компания | Сектор | Расходы на НИОКР в 2008 г. (млрд. долл. США) |
| Toyota Motor (Япония) | Автомобилестроение | 8 761 |
| Microsoft (США) | Программное обеспечение | 7 961 |
| GlaxoSmithKline (Великобритания) | Фармацевтика | 7 639 |
| Siemens AG (Германия) | Электроника | 6 913 |
| Pfizer (США) | Фармацевтика | 6 900 |
| Ford Motor (США) | Автомобилестроение | 6 854 |
| Sanofi-Aventis (Франция) | Фармацевтика | 6 816 |
| Intel (США) | Электроника | 6 812 |
| Volkswagen (Германия) | Автомобилестроение | 6 810 |
| Novartis AG (Швейцария) | Фармацевтика | 6 436 |
| Nokia (Финляндия) | Электроника | 6 376 |
| General Motors (США) | Автомобилестроение | 6 100 |
| Johnson & Johnson (США) | Фармацевтика | 6 049 |
| IBM (США) | Электроника | 6 037 |
| Matsushita Electric (Япония) | Электроника | 5 761 |
| Roche Holdings (Швейцария) | Фармацевтика | 5 720 |
| Nissan Motor (Япония) | Автомобилестроение | 5 529 |
| Merck & Co. (США) | Фармацевтика | 5 431 |
| Honda Motor (Япония) | Автомобилестроение | 5 131 |
| Motorola (США) | Электроника | 5 062 |
Источник: Global R&D Report 2008 Magazine, p.16
Диаграмма 5. ПОКАЗАТЕЛЬ НАЛОГОВЫХ ЛЬГОТ НА 1 ДОЛЛ. ЗАТРАТ НА НИОКР
Г.
Источник: Global R&D Report 2008 Magazine, p.11, 2009 Global R&D Funding Forecast, p.27

