


Построим график функции
 , на отрезке
  .
.
Вывод графика функции состоит из следующих этапов:
1. Задание вектора значений аргумента x.
Для того чтобы задать вектор, элементы которого, отличаются друг от друга на одинаковую величину (шаг), Используют двоеточие «:». Условно можно записать
x = [начальное условие: шаг: конечное условие],
если шаг равен 1, то его можно не указывать
x = [начальное условие: конечное условие].
Для более точного построения графика функции следует задавать малый шаг при вводе вектора x.
2. Вычисление вектора y значений функции  от каждого элемента вектора x.
При этом операции в выражении для функции должны выполняться поэлементно.
3.Вызов команды plot(x, y) для построения графика.
Создадим программу list_6

После выполнения команд на экране появляется окно Figure No. 1 с графиком функции в виде плавной кривой. Окно содержит меню, панель инструментов и область графика.

Оформление графиков.
Команда plot позволяет задать стиль, толщину и цвет линий, а также тип маркера.
Приведем в таблице некоторые свойства линий:
| Цвет | Тип маркера | Тип линий | |||
| y | желтый | 
| точка | – | сплошная |
| m | розовый | 
| кружок | : | пунктирная |
| c | голубой | 
| крестик | -. | штрихпунктирная |
| r | красный | + | знак «плюс» | -- | штриховая |
| g | зеленый | * | звездочка | ||
| b | синий | s | квадрат | ||
| w | белый | d | ромб | ||
| k | черный | v | треугольник вершиной вниз | ||
| ^ | треугольник вершиной вверх | ||||
| < | треугольник вершиной влево | ||||
| > | треугольник вершиной вправо | ||||
| p | пятиконечная звезда | ||||
| h | шестиконечная звезда |
Построим график функции в виде красной пунктирной линии толщиной 3. Для этого внесем изменения в программу list_6

Результатом выполнения программы будет график

Дополнительными элементами оформления графика являются: координатная сетка, подписи к осям, заголовок и легенда.
Сетка наносится командой grid on.
Подписи к осям размещаются при помощи команд xlabel, ylabel.
Заголовок дается командой title. (Для использования русских букв в заголовке, в аргументе команды title следует изменить название шрифта на Courier.)
Команда legend снабжает график информацией о линиях, размещенных на одних осях.
Использование в аргументах команд некоторых математических обозначений в формате TeX позволяет добавлять формулы на график.
Внесем изменения в программу list_6:

В результате выполнения программы получим график

Сравнение нескольких функций можно производить, отобразив их графики на одних осях. Например, построим графики на отрезке  графики функций
 и
и  .
.
Текс программы list_7

В результате получим график

Примечание. Третий параметр в команде legend управляет размещением в графическом окне. (0 – система выбирает лучшее месть в поле графика; 1 – легенда размещается в правом верхнем углу, 2 – легенда размещается в левом верхнем углу; 3 – легенда размещается в правом нижнем углу, 4 – легенда размещается в левом нижнем углу).
Для расположения нескольких графиков на одних осях можно также использовать команду hold on.
Команда
plot(x, f, x, g)
эквивалентна последовательности команд
plot(x, f)
hold on
plot(x, g).
Внесем изменения в программу list_7

Результат работы программы:

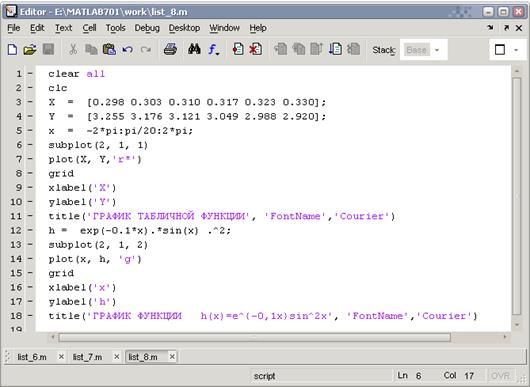
Для размещения нескольких осей в одном графическом окне используется команда
subplot, которая располагает графики в виде матрицы и используется с тремя параметрами: subplot(i, j, n), здесь iиj – число подграфиков по вертикали и горизонтали, а n – номер подграфика, который надо сделать текущим.
Например, построим график табличной функции

| 0,298 | 0,303 | 0,310 | 0,317 | 0,323 | 0,330 |

| 3,255 | 3,176 | 3,121 | 3,049 | 2,988 | 2,920 |
и функции  на отрезке
  в одном графическом окне и разных осях.
Программа list_8.
Результат работы программы:


