


Введение
MATLAB - матричная лаборатория - наиболее развитая система программирования для научно-технических расчетов, дополненная к настоящему времени несколькими десятками более частных приложений, относящихся к вычислительной математике, обралботке информации, конструированию электронных приборов, экономике и ряду других разделов прикладной науки. Изучение MATLAB'а по фирменной документации, которая теперь прилагается на инсталляционном компакт-диске, занимает у начинающих пользователей слишком много времени не только из-за необходимости читать ее на английском языке со специфическим слэнгом, но, главным образом, ввиду неизбежного для таких руководств последовательного и достаточно формального изложения большого объема информации, а имеющиеся на русском языке пособия в основном следуют этому стереотипу. Даже для опытного специалиста по расчетам на компьютере такое изучение сопряжено с неоправданно большими затратами труда.
MATLAB предназначен прежде всего для программирования численных алгоритмов. Он разрабатывается уже более 15 лет и возник на основе более ранних прикладных пакетов LINPACK и EIGPACK, созданных в 1970-е гг. в США, и в свою очередь повлиял на появление таких систем, как MathCad, MAPLE и Mathematica. Совершенствование системы MATLAB происходило как в связи с достижениями в вычислительной математике, так и в связи с изменениями в архитектуре персональных компьютеров и развитием общесистемных средств. Со временем MATLAB был дополнен целым рядом уже упоминавшихся приложений (toolboxes), далеко раздвинувших границы его применимости. Далее речь пойдет лишь о ядре MATLAB'а, которое мы будем называть системой, и конкретно о ее версии 5.2, выпущенной фирмой MathWorks в январе 1998 г.
MATLAB - система программирования высокого уровня, работающая как интерпретатор и включающая большой набор инструкций (команд) для выполнения самых разнообразных вычислений, задания структур данных и графического представления информации. Команды эти разбиты на тематические группы, расположенные в различных директориях системы. Теперь в системе около 800 команд, и примерно половина из них вполне доступна начинающему пользователю. Команды с большим возможным объемом вычислений написаны на С, но много и таких команд, которые представлены в терминах этих первых. Поэтому система оказывается почти открытой для пользователя. Имеются большие возможности для вывода двумерной и трехмерной графики и средства управления ею. Пользователь может без особых затруднений добавлять свои команды и писать программы в терминах уже существующих команд; несколько сложнее делать это в рамках Фортрана и С. Можно обмениваться данными с программами на этих языках, а из них обращаться к системе. Краткость и наглядность программирования и исключительные возможности визуализации результатов делают систему очень эффективной при поисках и апробации новых алгоритмов, при проведении разовых расчетов и в учебном процессе, поскольку ее можно осваивать без предварительного знакомства с основами программирования и выполнять такие сложные примеры, которые невозможно делать с использованием других систем.
Документация по системе и ее приложениям содержит много тысяч страниц, и поэтому естественно встает вопрос о том, как ее осваивать. Работа с системой требует определенной математической подготовки, так что обучение можно начинать на втором курсе вуза. Основные сведения о системе изложены в руководствах /1/ - /2/: /1/ - это учебник с описанием вычислительных возможностей и архитектуры системы, /2/ - описание ее графических возможностей. Конечно, можно читать подряд /1/, /2/ и при необходимости обращаться за уточнениями к команде help или справочнику /3/, в котором описаны почти все команды. Но гораздо более эффективным, на наш взгляд, является изложение основных вычислительных процедур с помощью наиболее употребительных команд системы. Именно так мы и познакомимся с MATLAB'ом, а точнее примерно с 30-40 его командами. После этих занятий пользоваться документацией /1/ и /2/ будет гораздо легче.
Приложений к системе мы здесь не касаемся, а изучать их можно только после предварительного ознакомления с ней, а также с тем разделом науки, которому посвящено конкретное приложение. Отметим только, что большинство приложений означают для пользователя просто расширение списка доступных ему команд. Очень удобно то, что вся документация по системе и приложениям находится на компакт-диске, с которого происходит их установка, и при желании она может быть размещена также и на винчестере.
Для работы с системой достаточно иметь компьютер PC 486 с оперативной памятью хотя бы 16 Mb и с установленными на нем системами Windows 95 и MATLAB 5.2. В действительности MATLAB может работать и с друогими операционными системами, такими, например, как Macintosh, Unix и OS/2.
За рубежом вышло уже достаточно много учебных пособий по системе, но на русский язык ни одно из них пока не переводилось и даже в центральных библиотеках их теперь нет из-за сокращения финансирования. Изданные у нас пособия (например, /4/ - /12/) в основном следуют руководствам /1/ - /3/, тогда как нам представляется полезным дать менее формальное введение в предмет, опираясь прежде всего на интуицию слушателя.
Работа с графиками в пакете Matlab.
На примере построения простейшего графика разберем основные возможности пакета Matlab по работе с этим типом объектов.
На рисунке 1 приведен пример построения графика функции y=sin(x) на отрезке [0;1].
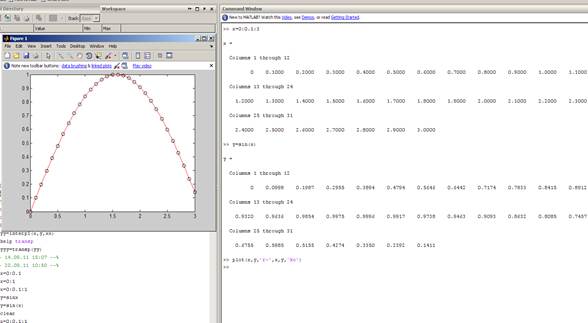
Рис.1
Он получается следующим набором команд
>> x=0:0.1:3
>> y=sin(x)
>> plot(x,y,'r-',x,y,'ko')
В общем случае, функция
plot(x1, y1, s1, x2, y2, s2, …)
позволяет отобразить несколько графиков функций y1(x1), y2(x2),…, проведя их со стилями s1, s2, …
В случае функции вида
plot(x, y, s1, x, y, s2)
мы можем провести линию графика единственной функции y1(x1) одним цветом, а точки на нём (вычисляемые точки) - другим цветом.
Стили s1, s2,… задаются в виде набора трёх символьных маркеров, заключенных в одиночные кавычки. Первый (не обязательно по порядку) из этих маркеров задаёт тип линии:
| Маркер | Тип линии |
| - | непрерывная |
| -- | штриховая |
| : | пунктирная |
| -. | штрих-пунктирная |
Второй маркер задаёт цвет:
| Маркер | Цвет линии |
| c | голубой |
| m | фиолетовый |
| y | жёлтый |
| r | красный |
| g | зелёный |
| b | синий |
| w | белый |
| k | чёрный |
Последний маркер задаёт тип проставляемых "точек":
| Маркер | Тип точки |
| . | точка |
| + | плюс |
| * | звёздочка |
| o | кружок |
| x | крестик |
Теперь построим тот же график, но только не сплошной красной линией, а толстой линией без кружков-маркеров.
x = 0: 0.1: 3; y = sin(x);
hPlot = plot(x, y);
set(hPlot, 'LineWidth', 7);
Функция plot через опорные точки с координатами x, y проводит прямые отрезки. Прямые линии в MATLAB – это графические объекты типа Line. Они имеют много свойств и характеристик, которые могут меняться. Доступ к этим объектам осуществляется по их описателям (дескрипторам; handles).
Описатель объекта Line возвращается функцией plot. Запоминаем его, чтобы использовать в дальнейшем. Функция set меняет характеристики передаваемого ей объекта. Свойство 'LineWidth' (толщина линии), для которого задали новое значение 7. В результате получим:

Рис.2
Текущее значение любого атрибута графического объекта возвращает функция get.
width = get(hPlot, 'LineWidth')
Оси координат MATLAB масштабирует автоматически. Чтобы в явном виде задать пределы изменения переменных на осях, необходимо использовать следующую функцию:
axis([ xmin, xmax, ymin, ymax ])
Этой командой можно пользоваться неограниченное число раз для уже построенного графика, рассматривая отдельные его участки:
axis([ 1.5, 2.5, 0.5, 2 ])
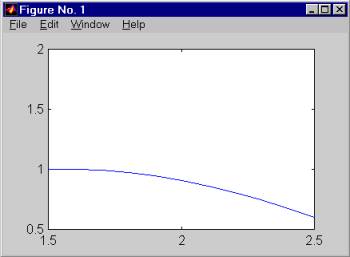
Рис.3
Чтобы изменить количество числовых меток на осях, применяют функцию set, которая обрабатывает объект Axes. Для получения описателя этого объекта применяется функция gca.
hAxes = gca;
set(hAxes, 'xtick', [ 1.5, 1.75, 2.0, 2.25, 2.5 ])

