


Найкращою моделлю можна вважати EQ01.


Y = -218594.046447 + 4069.21117808*X3 + 17662.7414418*X4 + 5284.75518039*X5
Вона є найкращою серед усіх можливих моделей,оскільки:
- відсутня мультиколінеарність
- всі незалежні змінні не зайві
- фактори не повторюються – збереження економічної умови;
- незалежні змінні значимі (Prob.<0,05) з імовірністю 95%;
- модель адекватна з рівнем надійності 95% (Prob.F<0,05);
- коефіцієнт детермінації=0.99>0.75, тобто модель якісна;
- скоригований коефіцієнт детермінації=0.98>0.75, тобто модель якісна.
Спочатку слід перевірити модель на нормальність збурень. Для того, щоб оцінки МНК мали найкращі статистичні властивості необхідно, щоб виконувалися вимоги теореми Гауса-Маркова. Якщо залишки регресії не матимуть нормального розподілу, то ми не зможемо перевіряти статистичні гіпотези через статистики Фішера та Стьюдента, які побудовані на припущені про нормальність збурень.
Для перевірки моделі на нормальність збурень застосуємо тест Харке-Бера, суть якого полягає в порівнянні практичного значення тесту (JB) з теоретичним значенням χ2. Якщо практичне значення не більше за теоретичне, то приймається гіпотеза про нормальність розподілу.
В EViews перевірка збурень на нормальність розподілу(тест Харке-Бера) проводиться наступним чином: в меню моделі вибрати View→Residual Diagnostics→Histogram-Normality Test. У результаті отримуємо гістограму розподілу залишків і розрахункове значення статистики Харке-Бера.

Як бачимо, практичне значення Харке-Бера становить JB=0.6925537 Теоретичне значення χ2 з рівнем надійності 0,95 дорівнює 5,99. Практичне значення менше за теоретичне (0.6925537<5,99)– залишки мають нормальний розподіл, тому ми можемо далі користуватися статистиками Фішера та Стьюдента, тому що виконується вимога теореми Гауса-Маркова. Також Probability=0.707322, що більше, ніж 0.05, отже це ще раз підтверджує гіпотезу про нормальний розподіл збурень.
Перевіримо обрану модель (EQ01) на адекватність та значимість коефіцієнтів.
Перевіримо модель на адекватність за допомогою критерію Фішера, а коефіцієнти на значущість за критерієм Стьюдента.
Щоб перевірити дану модель на адекватність потрібно порівняти практично знайдене значення F-статистики з теоретичним. Адекватність моделі означає, що відкидається гіпотеза про одночасну рівність всіх коефіцієнтів нулю (С(і)=0). Практичне значення EViews розраховує автоматично і в нашій моделі воно дорівнює: F-statistic=239.0098.
Тепер необхідно знайти теоретичне значення статистики Фішера з рівнем надійності 0,05 за формулою: Fteor=F(1-α;k-1;n-k), де (1-α) – ймовірність, (k-1) – кількість змінних без константи і (n-k) – ступені свободи. Для цього в EViews7 робимо наступне: Quick→GenerateSeries→fteor=@qfdist(0.95,4-1,14-4). Знайдене теоретичне значення статистики Фішера=3.7.
Отже, практичне значення більше за теоретичне (239.0098>3.7) і гіпотеза про одночасну рівність коефіцієнтів моделі нулю відхиляється, тобто модель адекватна.
Перевіримо гіпотезу про значимість коефіцієнтів моделі. Для цього порівнюємо Probability кожного коефіцієнта з рівнями значущості 0,05. Якщо Prob(Сі)>0,05, то коефіцієнти незначимі, і навпаки.
Prob(C)=0.0002, що менше 0,05 – коефіцієнт значимий з імовірністю 95%;
Prob(Х3)=0.0000, що менше 0,05 – коефіцієнт значимий з імовірністю 95%;
Prob(Х4)=0.0463, що менше 0,05 – коефіцієнт значимий з імовірністю 95%;
Prob(Х5)=0.0033, що менше 0,05 – коефіцієнт значимий з імовірністю 95%.
Також гіпотезу про значущість коефіцієнтів слід перевірити за допомогою статистики Стьюдента. Спочатку знаходимо його теоретичне значення з рівнем надійності 0,05 за формулою: Tteor=F(1-α/2;n-k), де (1-α/2) – ймовірність, (n-k) – ступені свободи. Для цього в EViews робимо наступне: Quick→GenerateSeries→tteor=@qtdist(1-0.05/2,14-4). Знайдене теоретичне значення статистики Стьюдента= 2.23.
Практичне значення статистики Стьюдента розраховується автоматично (t-Statistic):
t-Statistic(C)=5.745899>2.23;
t-Statistic(Х2)=8.625137>2.23;
t-Statistic(X3)=2.273682>2.23;
t-Statistic(Х6)=3.826752>2.23;
Отже, всікоефіцієнти значущі.
Перевіримо кінцеву модель на наявність гетероскедастичності збурень за допомогою та регресійних (Бройша-Пагана, Глейзера, Вайта) критеріїв.
Для перевірки моделі на гетероскедастичність за допомогою критерію Бройша-Пагана необхідно в меню моделі вибрати View→ResidualDiagnostics→HeteroskedasticityTest. Із запропонованого списку варіантів обираємо Breush-Pagan-Godfrey. Отримуємо наступний результат:


Як бачимо, Prob.(F)=0,3278>0,05 – гетероскедастичность відсутня.
Для перевірки моделі на наявність герероскедастичності застосуємо наступний критерій - Глейзера. Для цього в меню моделі вибираємView→ResidualDiagnostics→HeteroskedasticityTests… і обираємо Glejser. Отримуємо такий результат:


Як можна побачити з результатів, Prob.(F)=0,3365>0,05 - це вказує на відсутність гетероскедастичності залишків.
Критерій Уайта
Далі перевіряємо модель за критерієм Уайта. Знову ж в меню моделі вибираєм View→Residual Diagnostics→Heteroskedasticity Tests… і обираємо White. Результат буде наступним:

Забираєм галочку з Include White cross terms, тому що невелика кількість спостережень, менша ніж 80.

Як можна побачити з результатів, Prob.(F)=0,2646>0,05 - це вказує на відсутність гетероскедастичності залишків.
Отже, все критерії показали відсутність гетероскедастичності.
Перевіримо модель на наявність автокореляції за допомогою критеріїв Дарбіна-Уотсона та Бройша-Готфрі.
КритерійДарбіна-Уотсона.
При цьому методі необхідно знайти значення статистики Дарбіна-Уотсона. В ПП Views7 дане значення розраховується автоматично і для нашої регресії Durbin-Watson stat = 1.24. Тепер нам необхідно знайти верхнє (du) і нижнє (dl) критичні значення з таблиці Дарбіна-Уотсона для 95% надійного інтервалу: du=0,82, dl=1,75. Знайдені значення дають нам наступну інформацію: 1) проміжок [0; 0,82] – додатна автокореляція; 2) проміжок (0,82; 1,75) – зона невизначеності, куди і потрапляє наше значення статистики Дарбіна–Уотсона (1.76)
Критерій Бройша-Готфрі
Наступним кроком перевіряємо дану модель на наявність автокореляцій за допомогою критерію Бройша-Годфрі. Для цього необхідно в меню моделі вибрати View→ResidualDiagnostics→SerialCorrelation LM Test та ввести кількість лагів (2). Результат виглядатиме таким чином:
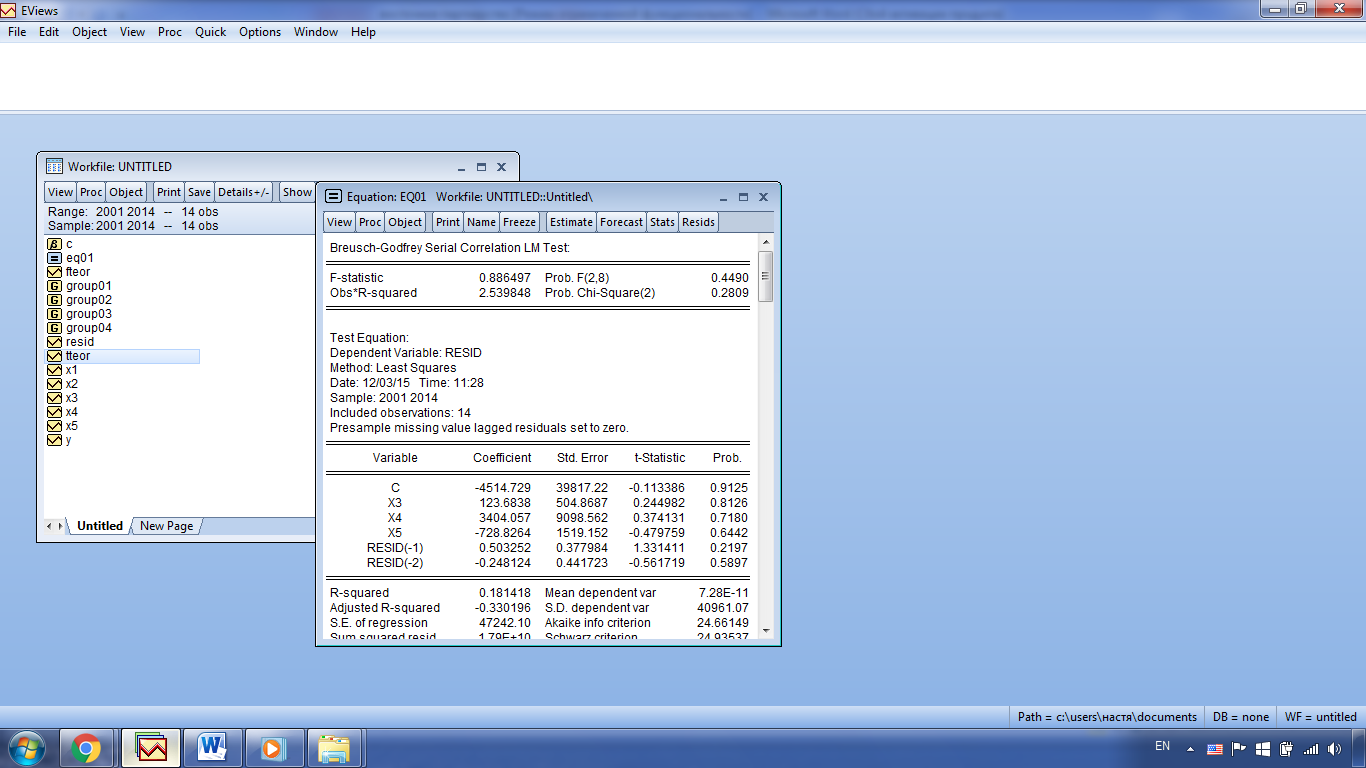
Як видно, Prob.F=0.4490>0,05, значить за критерієм Бройша-Годфрі автокореляція відсутня.
Перевіримо модель на стійкість. Гіпотеза про стійкість моделі полягає в тому, що параметри регресії однакові для обох груп спостережень. Модель є нестійкою, якщо її коефіцієнти суттєво залежать від того, на яких саме спостереженнях проводиться оцінка.
Спочатку скористаємось критерієм переламної точки Чоу, розбілимо спостереження приблизно навпіл, перевіривши 2007 рік. View→StabilityDiagnostics→ Chow Breakpoint Test.

В даному випадку Prob>0,05 – отже, в 2007 відсутні структурні зрушення.
Скористаємось пр огностичним критерієм Чоу для перевірки 2009 року ‑ рік світової фінансової кризи – оскільки у другій виборці споттережень менше, ніж в першій.В результаті отримуємо. Вибираємо в меню моделі View→StabilityDiagnostics→ChowForecastTest.


В даному випадку Prob>0,05 – отже, в 2009 відсутні структурні зрушення.
Перевіримо стабільність параметрів моделі за допомогою тесту CUSUM
Для цього в полі регресії скористаємось View→Stability Diagnostics→Recursive Estimate (OLS only)…


Значення статистики виходить за межі довірчого інтервалу в 2013 році, але в дуже незначній мірі, тому параметри моделі можна вважати стабільними.
4. Для обраної моделі проведемо аналіз еластичності та дамо на його основі порівняльну оцінку сили впливу факторів на результат. Визначте зміну залежної змінної при одиничній зміні кожного з факторів.
Для порівняння факторів регресії за ступенем їхнього впливу на залежну змінну використовуємо метод коефіцієнтів еластичності.
Суть методу: коефіцієнт еластичності показує на скільки % зміниться значення залежної змінної при зростанні однієї незалежної змінної на 1%, за умови, що всі інші фактори не зміняться. Для порівняння факторів потрібно відсортувати значення коефіцієнтів еластичності по модулю. Тоді найбільшій величині коефіцієнта буде відповідати найважливіший фактор.
Для застосування цього методу в ПП EViews7 обираємо в меню моделі View→CoefficientDiagnostics→ScaledCoefficients і отримуємо наступне:

За методом коефіцієнтів еластичності результати такі:
· Товарообіг (змінна х3) - найбільш впливовий фактор; при збільшенні товарообігу на 1% доходи населення (змінна у) збільшується на 0.630985%;
· Бюджетна підтримка України ЄС (змінна х5) - другий за впливом фактор; при збільшенні бюджетної підтримка України ЄС на 1% доходи населення (змінна у) збільшується на 0.463075%;
· Курс гривні до євро (змінна х4 ) – третій за впливом фактор; при збільшенні курсу гривні до євро на 1% доходи населення (змінна у) збільшиться на 0.463075%.
Визначимо зміну залежної змінної при одиничній зміні кожного з факторів:
· при збільшенні товарообігу на 1 млрд. дол. США доходи населення (змінна у) збільшується на 4069.211 млн. грн.;
· при збільшенні бюджетної підтримка України ЄС на 1 млн. євро доходи населення (змінна у) збільшується на 5284.755 млн. грн.;
· при збільшенні курсу гривні до євро на 1 грн. доходи населення (змінна у) збільшиться на 17662.74 млн. грн.
5. Розрахувємо для обраної моделі середню похибку апроксимації.
Розрахуємо середню похибку апроксимації, нажавши у меню моделі Forecast.

Похибка прогнозу RMSE=39471.08
MAPE=8.102293
Оскільки в економічних досліджуваннях припускаються похибки до 10%, то прогноз можна вважати якісним.
| Період | Y_факт | Y_прогноз | |(Y_факт-Y_прогноз)/Y_факт| | MAPE |
| 108835,00 | 82672,12 | 0,24039 | 8,10229 | |
| 191946,00 | 141656,84 | 0,26200 | ||
| 211922,00 | 212936,25 | 0,00479 | ||
| 264382,00 | 301468,90 | 0,14028 | ||
| 365923,00 | 408697,44 | 0,11689 | ||
| 475200,00 | 495555,50 | 0,04284 | ||
| 625868,00 | 665409,80 | 0,06318 | ||
| 850232,00 | 910847,68 | 0,07129 | ||
| 645049,00 | 635244,91 | 0,01520 | ||
| 752696,00 | 733206,59 | 0,02589 | ||
| 904916,00 | 920890,46 | 0,01765 | ||
| 1023132,00 | 938954,40 | 0,08227 | ||
| 1061886,00 | 1020360,80 | 0,03911 | ||
| 1122890,00 | 1136975,30 | 0,01254 | ||
| Сума | 1,13432 |
За допомогою Excel, також було розраховано середню похибку апроксимації:

6. За обраною моделлю порівняємо фактичні та модельні данні, побудуємо графік. Зробимо прогноз подальшого розвитку даного процесу (явища). Обрахуємо довірчі межі для параметрів моделі та прогнозного значення.
За допомоги команди Actual, Fitted, Residual→Actual, Fitted, ResidualTable, ми можемо побачити, наскільки розрахункові дані y, згідно з обраною нами моделлю, відрізняються від реальних. Маємо наступний результат:

Стовпчик «Residual Plot» показує, наскільки відрізняються емпіричні (Actual) та розрахункові (Fitted) дані. Як бачимо, модель дає можливості більш менш точного прогнозування.
Побудуємо графік:

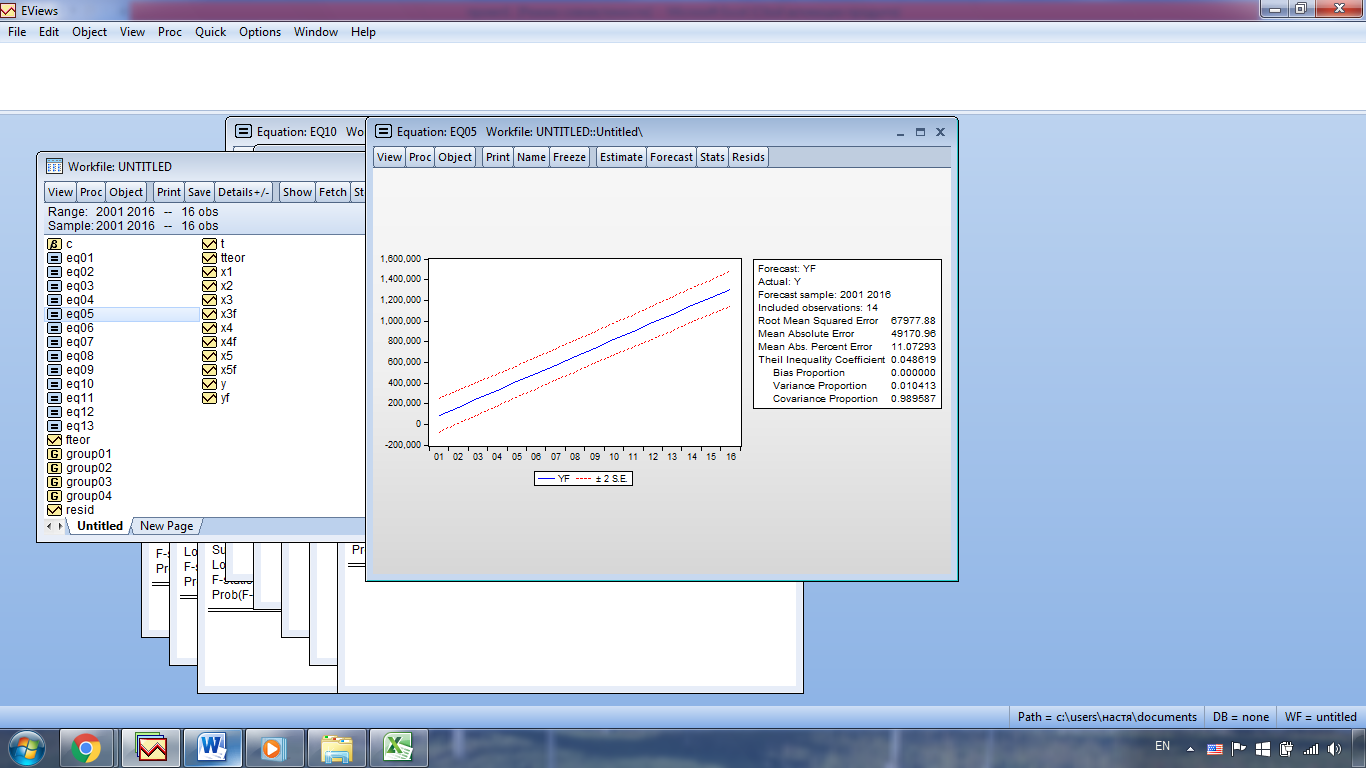
Зробимо прогноз на 2015-2016 рр. для залежної змінної на основі даних до 2014 включно.
Розширюємо діапазон значень Range на 2 роки.

Створюємо прогностичні значення для x3 x4 x5 за прикладом: Quick®EstimateEquitation® x3 c @trend і натискаємо кнопку Forecast. Створюється нова змінна x3f, яка містить у собі прогнозні значення на 2015-2016 р. Підставляємо цей прогноз у відповідні змінні x3.

Червоним вказуються довірчі межі параметрів моделі та прогнозного значення.
У вже відомій моделі створюємо прогностичні дані для залежної змінної y, нажавши у меню моделі Forecast.

Червоним вказуються довірчі межі параметрів моделі та прогнозного значення.

Отже, ми отримали такий прогноз на 2015-2016 р.:
| Рік | Прогноз доходів населення, млн. грн. | Нижня межа прогнозу, млн. грн. | Верхня межа прогнозу, млн. грн. |
| 1216757.986827598 | |||
| 1297041.175547468 |
7. Побудуємо для досліджуваного показника (залежної змінної): лінійну, експоненційну, логарифмічну, степеневу та поліноміальні (від 2 до 6 ступеня) моделі, використовуючи час в якості незалежної змінної.
Створимо нову змінну час (t).


Для показника у побудуємо моделі різних видів:
- лінійну;
- експоненційну;
- логарифмічну;
- степеневу;
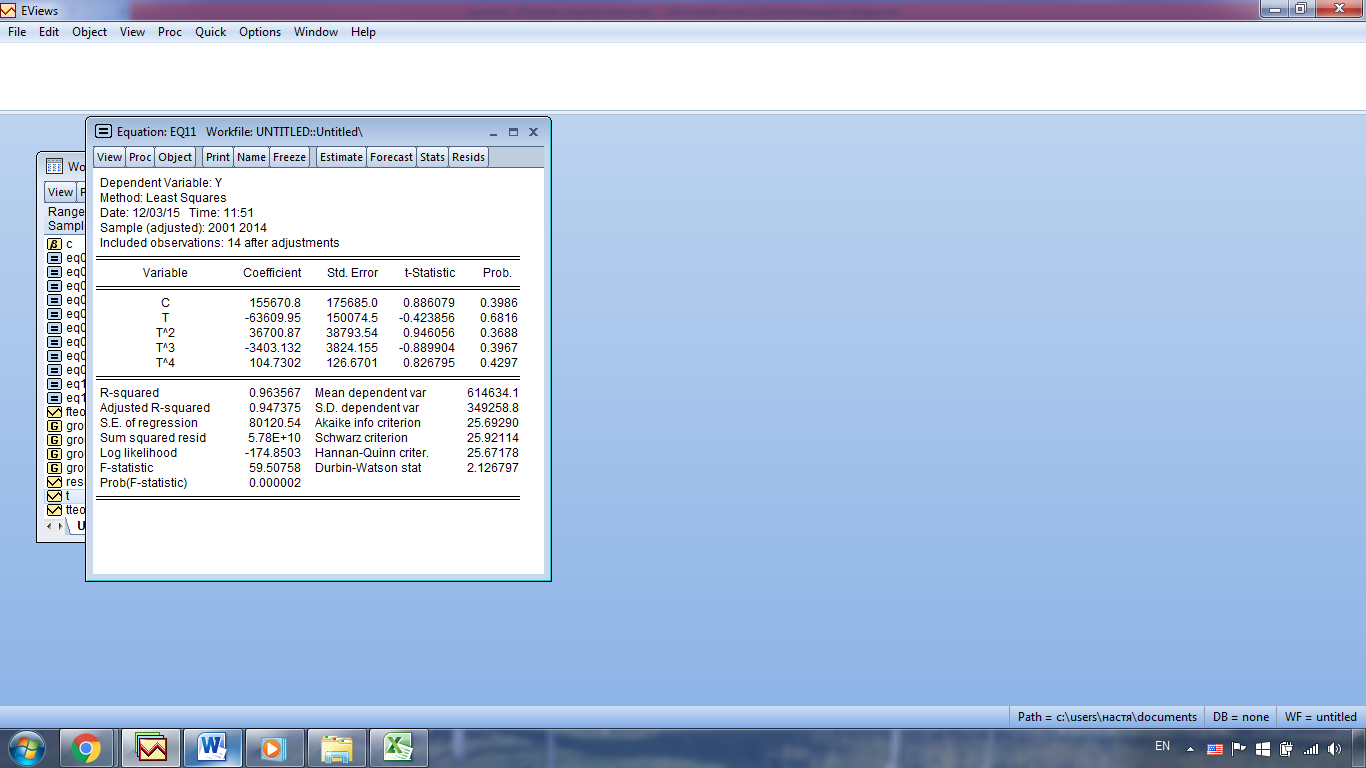
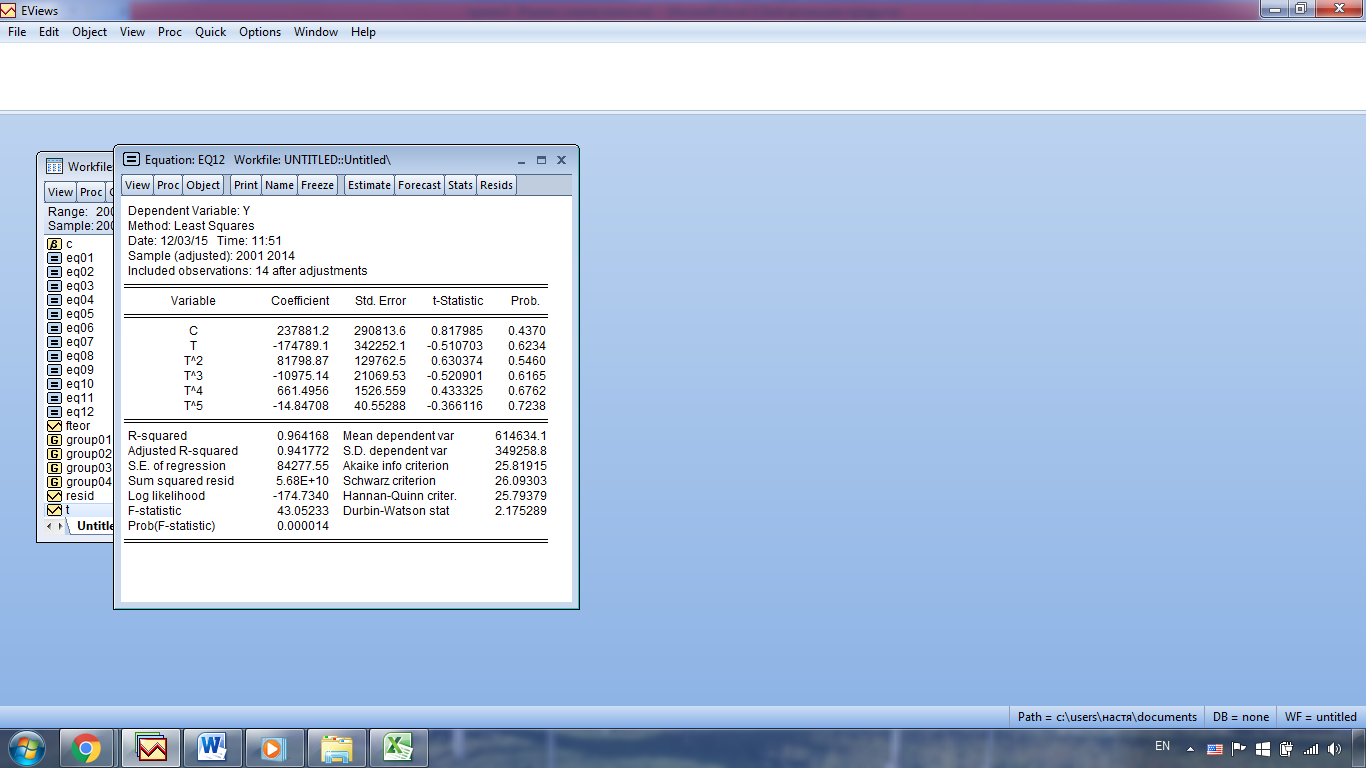
- поліноміальну(2-6 ступінь).
Лінійна:

Експоненційна:

Логарифмічна:

Степенева:

Полінаміальна (2-го ступеня):

Полінаміальна (3-го ступеня):

Полінаміальна (4-го ступеня):
Полінаміальна (5-го ступеня):
Полінаміальна (6-го ступеня):

.
8. Оберемо найбільш адекватну модель та обґрунтуємо свій вибір. Побудувємо графік порівняння фактичних і модельних даних. Зробимо прогноз на наступний період.
Проаналізувавши усі побудовані моделі, можна дійти висновку, що найбільш адекватною є модель поліноміальна 6 ступеню. Показник R-squared найбільший і близький до 1, що свідчить про високу адекватність моделі (0,96), а також всі незалежні змінні значущі.

Y = 1373.75824176 + 81768.0417582*T
Розрахуємо прогноз на 2015-2016 рр:

Отже, ми отримали такий прогноз на 2015-2016 р.:
| Рік | Прогноз доходів населення, млн. грн. | Нижня межа прогнозу, млн. грн. | Верхня межа прогнозу, млн. грн. |
| 1227894.384615385 | |||
| 1309662.426373627 |
9. Дамо економічний висновок отриманим кількісним результатам моделювання.
В ході проведеного дослідження було побудовано дві найкращі моделі:
EQ01: Y = -218594.046447 + 4069.21117808*X3 + 17662.7414418*X4 + 5284.75518039*X5
EQ05: Y = 1373.75824176 + 81768.0417582*T
З моделі EQ01 можна зробити висновок про те що на доходи населення України впливають наступні незалежні зміні:
1) Товарообіг України з ЄС, млрд. дол. США
2) Курс гривні до євро
3) Бюджетна підтримка України ЄС, виділено млн.євро
Тому, початкову гіпотеза підтверджується.
З моделі EQ05 ми бачимо, що доходи населення України залежить від часу, функція є лінійною.
Можна стверджувати, що отримані результати досить добре корелюють із відомими економічними законами та теоріями.
Список використаних джерел:
1) Арутюнян О. Восточное партнерство ЕС: второе дыхание // ОБОЗРЕВАТЕЛЬ-OBSERVER. №1. – 2012. – С. 90-97
2) Бюджетна підтримка ЄС в Україні. Під загальною редакцією Наталії Старостенко, автори Наталія Старостенко, Олена Саєнко, Вікторія Колосова, Наталія Слинько. – К.: ФОП Москаленко О. М., 2014. – 60 с.
3) Курылев К. П. ПРОБЛЕМА УЧАСТИЯ УКРАИНЫ В ПРОГРАММЕ ЕВРОПЕЙСКОГО СОЮЗА «ВОСТОЧНОЕ ПАРТНЕРСТВО» / Политология. ‑ № 4(30). – 2013. – С. 96-102.
4) Офіційна служба статистики України / http://www.ukrstat.gov.ua/
5) Офіційний сайт представництва ЄС в Україні http://eeas.europa.eu/delegations/ukraine/index_uk.htm/

