


Ћабораторна€ работа 2.
“ема: ѕостроение графиков
÷ель: научить строить графики функций: в декартовой системе координат, заданные параметрически, в пол€рной системе координат и трехмерные графики.
ќбщие сведени€
¬ MathCAD встроено несколько различных типов графиков, которые можно разбить на две большие группы.
ƒвумерные графики:
Ј X-Y (декартовый) график (X-Y Plot);
Ј пол€рный график (Polar Plot).
“рехмерные графики:
Ј график трехмерной поверхности (Surface Plot);
Ј график линий уровн€ (Contour Plot);
Ј трехмерна€ гистограмма (3D Bar Plot);
Ј трехмерное множество точек (3D Scatter Plot);
Ј векторное поле (Vector Field Plot).
ƒеление графиков на типы несколько условно, т. к., управл€€ установками многочисленных параметров, можно создавать комбинации типов графиков, а также новые типы (например, двумерна€ гистограмма распределени€ €вл€етс€ разновидностью простого X-Y графика).
ƒл€ построени€ графиков используютс€ шаблоны. »х перечень содержитс€ в команде меню ¬ставкаЃ√рафики. Ѕольшинство параметров графического процессора, необходимых дл€ построени€ графиков, по умолчанию задаетс€ автоматически. ѕоэтому дл€ начального построени€ того или иного вида достаточно задать тип графика. ¬ подменю Graph содержитс€ список из семи основных типов графиков.
| X-Y Plot | √рафик в декартовой системе координат |
| Polar Plot | √рафик в пол€рных координатах |
| Surfase Plot | “рехмерный график |
| Contour Plot | онтурный график трехмерной поверхности |
| 3D Scatter Plot | √рафик в виде точек (фигур) в трехмерном пространстве |
| 3D Bar Chart | √рафик дл€ изображени€ в виде совокупности столбиков в трехмерном пространстве (гистограмма) |
| Vector Field Plot | √рафик векторного пол€ на плоскости |
MathCAD представл€ет пользователю разнообразные средства форматировани€ графика ‑ изменение толщины и цвета линий, вида осей координат, координатные сетки, текстовые комментарии и др. ƒл€ того чтобы изменить вид изображени€, нужно щелкнуть дважды по полю графика и установить требуемые параметры в окнах настройки.
√рафики любого вида, как любые объекты документа, можно выдел€ть, заносить в буфер обмена, вызывать их оттуда и переносить в любое новое место документа. »х можно и просто перетаскивать с места на место курсором мыши, а также раст€гивать по горизонтали, по вертикали и по диагонали, цепл€€сь за специальные маркеры выделенных графиков курсором мыши.
ѕор€док действий при построении всех графиков одинаков. ѕосле выбора шаблона построени€ графика в рабочем документе открываетс€ поле построени€ графика с помеченными дл€ ввода позици€ми, которые нужно заполнить дл€ определени€ графика.
огда график определен (заполнены все помеченные позиции), то дл€ построени€ графика при автоматическом режиме вычислений достаточно щелкнуть мышью вне пол€ графика.
«аполнение шаблона дл€ разных типов графиков имеет свои особенности.
ћожно начертить несколько кривых на одном и том же чертеже. „тобы представить графически несколько выражений по оси ординат относительно одного выражени€ по оси абсцисс, введите первое выражение по оси ординат, сопровождаемое зап€той. Ќепосредственно под первым выражением по€витс€ пустое поле. ¬ведите туда второе выражение, сопровождаемое другой зап€той, чтобы получить пустое поле, и т. д.
|
|
|
„тобы построить несколько независимых кривых на одном чертеже, введите два или более выражени€, отдел€емых зап€тыми по оси абсцисс, и то же самое выражение по оси ординат. MathCAD согласует выражени€ попарно ‑ первое выражение по оси абсцисс с первым выражением по оси ординат, второе со вторым и т. д. «атем рисуетс€ график каждой пары.
ћожно построить до 16 функций по оси ординат в зависимости от одного аргумента по оси абсцисс. ќднако если дл€ каждой кривой используетс€ свой аргумент, то можно отобразить только до 10 графиков.
“очно так же можно построить несколько графиков на одном и том же чертеже в пол€рных координатах, использу€ эту же технологию заполнени€ шаблона графика.
‘орматирование графиков
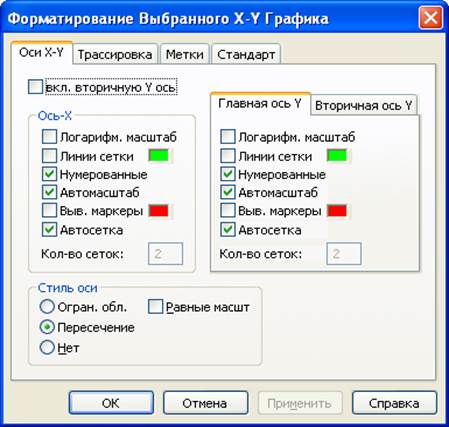
„тобы изменить формат графика, необходимо дважды щелкнуть мышью в области графика.
≈сли строим график в декартовой системе координат, то по€витс€ следующее диалоговое окно дл€ форматировани€ графика (разные типы графиков имеют разный вид диалоговых окон, но аналогичную технологию форматировани€).
‘орматирование оси графика можно также произвести, выполнив на ней двойной щелчок.
¬ MathCAD можно делать следующие надписи на чертеже:
Ј заголовок выше или ниже графика;
Ј названи€ осей, чтобы описать, что отложено на каждой оси;
Ј имена кривых, идентифицирующих отдельные графики;
Ј переменные ‑ выражени€, определ€ющие координаты.
ћожно использовать эти надписи все вместе или в любой комбинации.
ƒл€ того чтобы добавить заголовок к графику в диалоговом окне дл€ форматировани€ графика, следует щелкнуть по закладке Labels (ћетки) и напечатать заголовок графика в поле Title (Ќазвание). ѕометить место размещени€ заголовка: кнопка Above (¬верху) или Below (¬низу) и удостоверитьс€, что флажок Show Title (¬ыводить) отмечен.
„тобы надписать одну или обе оси графика, необходимо указать название осей в поле ћетки осей.
ћожно построить до 16 разных графиков. аждому графику соответствует строка в прокручивающемс€ списке, который откроетс€, если в диалоговом окне дл€ форматировани€ графика щелкнуть по вкладке Traces (“рассировка). Ќа этой вкладке можно изменить параметры: тип, цвет, толщину линии.
ѕо мере по€влени€ новых графиков MathCAD ставит в соответствие каждому одну из этих строк.
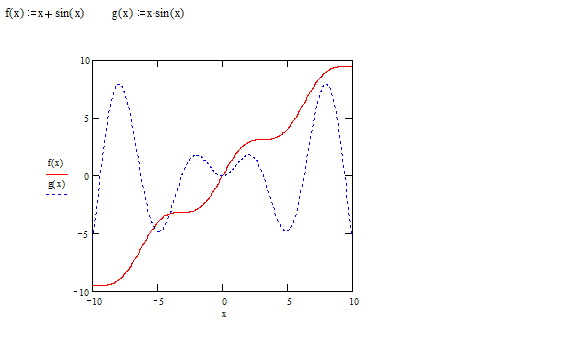
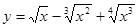
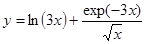
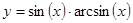
ѕостроение графика функции y = f(x)
ѕример 1
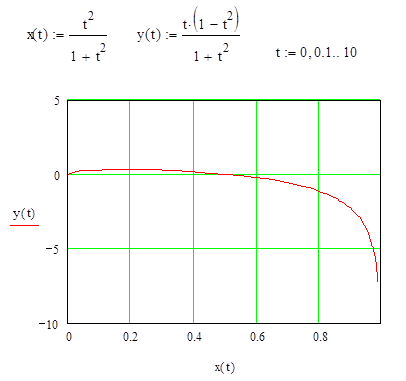
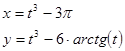
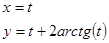
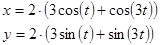
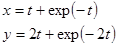
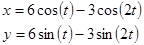
ѕостроение кривой, заданной параметрически
ѕостроение кривой, заданной параметрически, осуществл€етс€ аналогично. ќтличие состоит в том, что в позиции аргумента и функции ввод€тс€ выражени€ или имена соответствующих функций.
ѕример 2
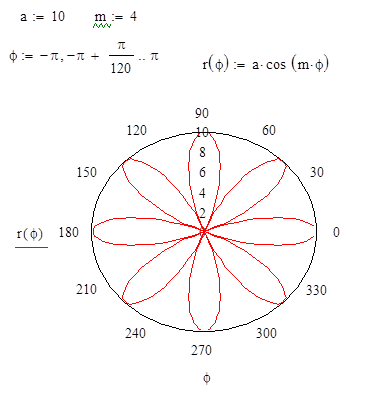
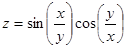
√рафики в пол€рной системе координат
¬ пол€рной системе координат кажда€ точка задаетс€ углом j и модулем радиуса-вектора r(j). √рафик функции обычно строитс€ в виде линии, которую описывает конец радиуса-вектора при изменении угла j в определенных пределах, чаще всего от 0 до 2p. ќпци€ ѕол€рные координаты (Polar Plot ) выводит шаблон таких графиков в форме окружности с шаблонами данных.
ѕеред построением таких графиков надо задать значени€ переменной j и функцию r(j).
|
|
|
ѕример 3
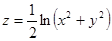
√рафики поверхностей
“рехмерные, или 3D-графики, отображают функции двух переменных вида Z(X, Y).
ѕри построении трехмерных графиков в ранних верси€х MathCAD поверхность нужно было определить математически.
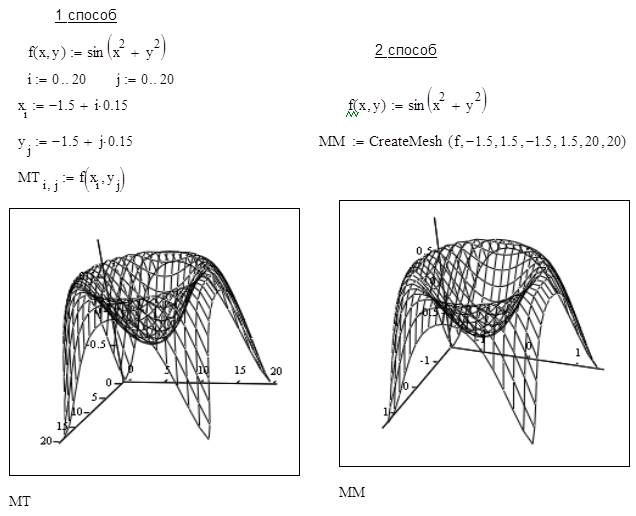
“еперь примен€ют функцию MathCAD CreateMesh.
‘ункци€ CreateMesh (F (или G, или f1, f2, f3), x0, x1, y0, y1, xgrid, ygrid, fmap) ‑ создает сетку на поверхности, определенной функцией F.
x0, x1, y0, y1 Ц диапазон изменени€ переменных; xgrid, ygrid Ц размеры сетки переменных; fmap Ц функци€ отображени€.
‘ункци€ CreateMesh по умолчанию создает сетку на поверхности с диапазоном изменени€ переменных от Ц5 до 5 и с сеткой 20´20 точек.
ѕример 4. (ѕостроение графиков поверхности двум€ способами)
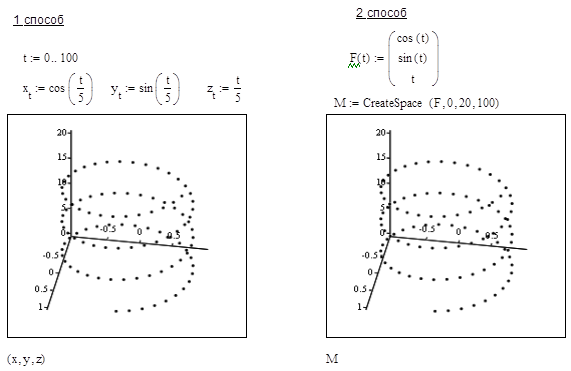
Ќередко поверхности и пространственные кривые представл€ют в виде точек, кружочков или иных фигур. “акой график создаетс€ операцией ¬ставка Ѓ √рафик Ѓ 3D “очечный, причем поверхность задаетс€ параметрически Ц с помощью трех матриц (X, Y, Z).
ƒл€ определени€ исходных данных дл€ такого вида графиков используетс€ функци€ CreateSpace.
‘ункци€ CreateSpace (F, t0, t1, tgrid, fmap) ‑ возвращает вложенный массив трех векторов, представл€ющих х, у, и z ‑ координаты пространственной кривой, определенной функцией F. t0 и t1 Ц диапазон изменени€ переменной, tgrid Ц размер сетки переменной, fmap Ц функци€ отображени€.
≈ще один вид представлени€ поверхности ‑ векторное представление. ќно задаетс€ построением коротких стрелочек ‑ векторов. —трелки обращены острием в сторону нарастани€ высоты поверхности, а плотность расположени€ стрелок зависит от скорости этого нарастани€.
ƒл€ его построени€ используетс€ шаблон Vector Field Plot (график векторного пол€ на плоскости). ¬ шаблон необходимо внести им€ матрицы M.
ѕример 5. ѕостроение точечного графика двум€ способами
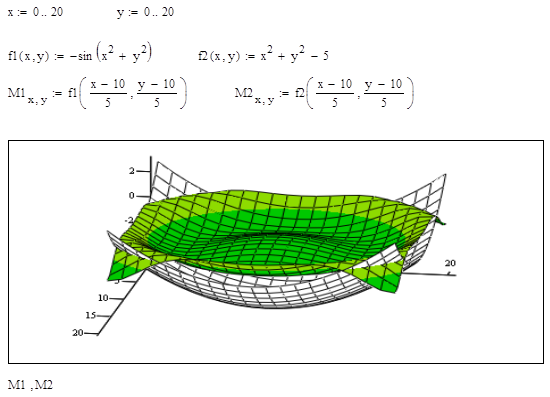
ѕостроение пересекающихс€ фигур
ќсобый интерес представл€ет собой возможность построени€ на одном графике р€да разных фигур или поверхностей с автоматическим учетом их взаимного пересечени€. ƒл€ этого надо раздельно задать матрицы соответствующих поверхностей и после вывода шаблона 3D-графика перечислить эти матрицы под ним с использованием в качестве разделител€ зап€той.
«адани€ к лабораторной работе 2
«адание є 1
ѕостройте графики функций.
| ¬ариант | ‘ункци€ одной переменной | ѕол€рна€ система координат | ‘ункци€ двух переменных |
| 
| 
| |
| 
| 
| |
| 
| 
| |

| 
| 
| |

| 
| 
| |
| 
| 
| |

| 
| 
| |

| 
| 
| |
| 
| 
| |
| 
| 
| |

| 
| 
| |
| 
| 
| |

| 
| 
| |
| 
| 
| |
| 
| 
| |
| 
| 
|
«адание є 2
ќтобразить графически пересечение поверхностей  и
и  . ћатрицы дл€ построени€ поверхностей задать с помощью функции CreateMesh.
онтрольные вопросы
1. ак построить график?
2. ак построить несколько графиков в одной системе координат?
3. ак построить декартовый график?
4. ак отформатировать построенный график?
5. ак построить график кривой, заданной параметрически?
6. ак построить график в пол€рной системе координат?
7. ак построить график поверхности?
8. ƒл€ чего используютс€ функции CreateMesh, CreateSpace?

