


АВТОМАТИЗИРОВАННОЕ ПРОЕКТИРОВАНИЕ.
РАБОТА В СИСТЕМЕ MATLAB

Красноярск 2008
УДК 32.973.26.-018.2
П 12
Автоматизированное проектирование. Работа в системе MATLAB: Лабораторный практикум для студентов по направлению 190100.62 – «Наземные транспортные системы» и по специальности 230103 – «Техническая эксплуатация транспортных и технологических машин и оборудования (дорожные и коммунальные машины)» / В.П. Павлов. – Красноярск: ПИ СФУ, 2008. 31 с.
Лабораторный практикум включает первоначальное знакомство с системой MATLAB, пять лабораторных работ по разделам курса «Компьютерные технологии в строительных, дорожных и коммунальных машинах», каждая из которых имеет краткое описание метода, задания по вариантам и контрольные вопросы, а также фрагменты выполнения работ на MATLAB. Практикум снабжен таблицами и литературой.
СОДЕРЖАНИЕ
Общие сведения о MATLAB
Часть 1
Лабораторная работа 1.
Математика и вычисления..................................... 19
Лабораторная работа 2.
Научная и инженерная графика............................... 21
Лабораторная работа 3.
Вычислительный эксперимент, программирование, разработка приложений....................................................23
Лабораторная работа 4.
Кинематика процесса копания грунта поворотом ковша экскаватора... 25
Часть 2
Лабораторная работа 5.
Оценка копающей способности экскаватора при разработке грунтов различной прочности...................................
Лабораторная работа 6.
Моделирование производительности одноковшового экскаватора........
Лабораторная работа 7.
Создание экспертной системы. Алгоритм Мамдани....................
Общие сведения о MATLAB
Сейчас возможности системы значительно превосходят возможности первоначальной версии матричной лаборатории Matrix Laboratory. Нынешний MATLAB, детище фирмы The MathWorks, Inc., – это высокоэффективный язык инженерных и научных вычислений. Он поддерживает математические вычисления, визуализацию научной графики и программирование с использованием легко осваиваемого операционного окружения. Наиболее известные области применения системы MATLAB:
 математика и вычисления;
разработка алгоритмов;
вычислительный эксперимент, имитационное моделирование, макетирование;
анализ данных, исследование и визуализация результатов;
научная и инженерная графика;
разработка приложений, включая графический интерфейс пользователя.
MATLAB - это интерактивная система, основным объектом которой является массив, для которого не требуется указывать размерность явно. Это позволяет решать многие вычислительные задачи, связанные с векторно-матричными формулировками.
Версия MATLAB 6.1 - это предпоследнее достижение разработчиков (последнее - MATLAB 6.5).
Система MATLAB - это одновременно и операционная среда и язык программирования. Одна из наиболее сильных сторон системы состоит в том, что на языке MATLAB могут быть написаны программы для многократного использования. Пользователь может сам написать специализированные функции и программы, которые оформляются в виде М-файлов. Именно поэтому пакеты прикладных программ - MATLAB Application Toolboxes, входящие в состав семейства продуктов MATLAB, позволяют находиться на уровне самых современных мировых достижений.
Операционная среда системы MATLAB 6.1. Операционная среда системы MATLAB 6.1 - это множество интерфейсов, которые поддерживают связь этой системы с внешним миром через диалог с пользователем через командную строку, редактор М-файлов, взаимодействие с внешними системами Microsoft Word, Excel и др.
После запуска программы MATLAB на дисплее компьютера появляется её главное окно, содержащее меню, инструментальную линейку с кнопками и клиентскую часть окна со знаком приглашения  . Это окно принято называть командным окном системы MATLAB (рис. 1).

Рис.1

Рис. 2.
 Меню Файл (рис. 2) объединяет обычные функции: Правка отвечает за изменение содержания Окна команд (отмена, повтор, вырезать, копировать, вставить, выбрать всё, удалить и др.) и за очистку некоторых окон MATLAB; меню Вид – за оформление Рабочего стола; меню Web – запускает Web-страницы из Internet; меню Окно – работает с редактором/отладчиком М-файлов (закрывает все М-файлы, делает текущим один из них); меню Помощь – работает со справочной документацией и демонстрациями.
Особого рассмотрения заслуживает опция Предпочтения... (выбор характеристик), которая при выборе открывает окно, включающее слева дерево объектов (рис. 3), а справа их возможные характеристики.
Инструментальная панель командного окна системы MATLAB позволяет обеспечить простой доступ к операциям над М-файлами: создание нового М-файла; открытие существующего М-файла; удаление фрагмента; копирование фрагмента; вставка фрагмента; восстановление только выполненной операции и др.
В клиентской части командного окна MATLAB после знака приглашения можно вводить различные числа, имена переменных и знаки операций, что в совокупности составляет некоторые выражения. Нажатие клавиши Enter заставляет систему MATLAB вычислить выражение или, если оно не вычисляется, повторить его. Хотя знак «;» в конце строки гасит вывод результата (эхо-вывод).
Пример.
>> a=2
a =
>> b=4;
>> с=a+b
с =
Таким образом, в клиентской части командного окна MATLAB пользователь может сразу писать команды, образующие отдельные вычисления или целую программу.
Итак, были подвергнуты разбору структурные части командного окна MATLAB. Но кроме них существуют ещё несколько элементов MATLAB, которые помогают при работе:
 Команды - окно, содержащее по порядку введённые ранее команды в Окне команд («история команд»).
Рабочая область – это область памяти MATLAB, в которой размещены переменные системы. Содержимое этой области можно просмотреть из командной строки с помощью команд who (выводит только имена переменных) и whos (выводит информацию о размерах массивов и типе переменной) или в отдельном окне под тем же названием. В нём можно выполнить следующие операции: загрузить файл данных, сохранить Рабочую область как (команды позволяют открыть и сохранить содержимое рабочей области в двоичном MAT-файле), удалить выбранные переменные; открыть выбранные переменные (где можно изменить их значение). Кроме этого в меню Правка можно очистить как Окно команд и Историю команд, так и Рабочую область (или выполнить команду в Окне команд: clear).
Для сохранения и запуска Рабочей области можно использовать команды load и save.
 Пример.
>> save
Saving to: matlab.mat
>> load
Loading from: matlab.mat
>> save my.mat
>> load my.mat
>> save my2
>> load my2
Текущий каталог – окно, являющееся своеобразным «проводником» по каталогам MATLAB.
Запустить Редактор – окно, отражающее дерево структурных элементов MATLAB и других установленных вместе с ним программных средств, которые можно запускать двойным левым щелчком мыши. Например, это окно может выглядеть, как показано на рис 9.
Редактор/отладчик М-файлов – один из важнейших структурных частей MATLAB, который может быть открыт выбором соответствующей опции в главном меню, на инструментальной панели или вызван из командной строки командой edit или edit <имя М-файла> и позволяющий создавать и редактировать М-файлы.
Редактор/отладчик поддерживает следующие операции: создание нового М-файла; открытие существующего М-файла; сохранение М-файла на диске; удаление фрагмента; копирование фрагмента; вставка фрагмента; помощь; установить/удалить контрольную точку; продолжить выполнение и др.
GUIDE – графический интерфейс пользователя, в котором происходит создание законченных приложений.
Интерактивный сеанс работы. М-файлы. Интерактивный режим – это пользовательский режим ввода с клавиатуры команд и выражений, в результате выполнения которых получаются необходимые числовые результаты, которые можно легко и быстро визуализировать встроенными графическими средствами пакета MATLAB. Но использование этого режима для создания и сохранения конкретной программы невозможно. Поэтому создатели MATLAB кроме Окна команд, в котором реализован интерактивный режим, выделили специальные файлы, содержащие коды языка MATLAB, и назвали M-файлами (*.m). Для создания M-файла используется текстовый редактор (редактор/отладчик М-файлов).
Работа в редакторе M-файлов. Работа из командной строки MatLab затрудняется, если требуется вводить много команд и часто их изменять. Самым удобным способом выполнения команд является использование M -файлов, в которых можно набирать команды, выполнять их все сразу или частями, сохранять в файле и использовать в дальнейшем. Для работы с M -файлами предназначен редактор M -файлов. При помощи редактора можно создавать собственные функции и вызывать их, в том числе и из командной строки.
Раскройте меню File основного окна MatLab и в пункте New выберите подпункт M-file. Новый файл открывается в окне редактора M -файлов (рис. 10). Запишем в файл программу вычисления среднего арифметического пере-

Рис. 10
менных a и b, затем сохраним с именем fun1.m. Сравните способы решения задачи, представленные в таблице.
| >> a = 7.5; b = 3.342; c = (a+b)/2 c = 5.4210 | >> fun1 c = 5.4210 |
Пример. Создание двух графиков в одном окне Figure. В окне редактора напишем текст программы и сохраним с именем fun2.m. После выполнения команды >> fun2 а окне Figure отображаются два графика (рис. 11).
| Содержание файла fun2.m |
| x=[0: 0.1: 7]; f=exp(-x); subplot(1, 2, 1) plot(x, f) g=sin(x); subplot(1, 2, 2) plot(x, g) |

Рис. 11
Существует два типа M-файлов: М-сценарии и М-функции со своими характеристиками. Рассмотренные выше примеры fun1 и fun2 относятся к М-сценариям.
М-сценарий:
1. Предназначен для автоматизации последовательности шагов, которые нужно выполнять много раз.
2. Не использует входных и выходных аргументов.
3. Оперирует с данными из рабочей области.
4. Структура М-сценария в отличие от М-функции не включает строку определения функции.
5. Запуск из Редактора/Отладчика выбором соответствующего пункта меню (Отладка/Запуск) или нажатием F5.
М-функция:
1. Предназначена для расширения возможностей языка MATLAB (библиотеки функций, пакеты прикладных программ).
2. Использует входные и выходные аргументы.
3. По умолчанию, внутренние переменные являются локальными по отношению к функции.
1) Строка определения функции задаёт имя, количество и порядок следования входных и выходных аргументов.
Например: function y = funa(x,a), где function - ключевое слово, определяющее М-функцию; y - выходной аргумент; funa - имя функции; x, а - входные аргументы.
Если функция имеет более одного выходного аргумента, список выходных аргументов помещается в квадратные скобки: function [x, y, z] = funb(t, p, r).
Если имя файла и имя функции в строке определения функции разные, то при запуске используется имя файла, а внутреннее имя игнорируется. На имена М-функций налагаются те же ограничения, что и на имена переменных - их длина не должна превышать 31 символа; они должны начинаться с буквы; остальные символы могут быть любой комбинацией букв, цифр и подчеркиваний.
2) Комментарий выводится на экран после знака % в любом месте. Первая строка комментария отражается в Окне команд, когда пользователь запускает команду help <имя_функции>.
3) Тело функции - это программный код, который реализует вычисления и присваивает значения выходным аргументам.
Пример.
Функция должна находится в текущей директории. Имена входных переменных могут, но не обязаны совпадать с именами, указанными в строке определения функции.
При оперировании с М-файлами можно использовать следующие команды: вывести на экран имена файлов текущего каталога: what; вывести на экран текст M-файла fact.m: type fact.
Типы данных в MATLAB. Самое важное в структуре М-файлов это тело М-функции или М-сценария, которое содержит код языка MATLAB и выполняет вычисления и присваивает значения выходным аргументам. Операторы в теле функции или сценария могут состоять из вызовов функций, программных конструкций для управления потоком команд, интерактивного ввода/вывода, вычислений, присваиваний, комментариев и пустых строк. Но самое главное сначала разобраться с типами данных в MATLAB, а уже потом рассматривать синтаксис и построение М-языка.
В системе MATLAB определено шесть базовых типов данных, каждый из которых является многомерным массивом. Шесть классов - это double, char, sparse, uint8, cell, и struct. Двумерные версии этих массивов называются матрицами, откуда MATLAB и получил свое имя МАТричная ЛАБоратория.
Чаще всего приходится иметь дело только с двумя из этих типов данных: массив чисел удвоенной точности (double) и массив символов (char) или просто строка. Это связано с тем, что все вычисления в системе MATLAB выполняются с удвоенной точностью и большинство функций работают с массивами чисел удвоенной точности или строками.
Рабочая область MATLAB при введении переменных, описанных в таблице, представлена на рис. 10.
Схема принадлежности того или иного объекта системы MATLAB к одному из классов имеет вид, представленный на рис. 11. Соединительные линии на ней определяют принадлежность того или иного типа данных к одному или нескольким классам.

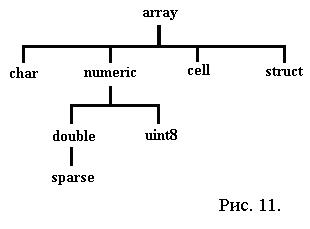
Обратите внимание, что тип array (массив) находится в вершине схемы. Это означает, что все данные системы MATLAB являются массивами (тип array является виртуальным).
Каждому типу данных можно соотнести свои функции и операторы обработки, или другими словами, методы. Дочерние типы данных, расположенные на диаграмме ниже родительского типа, поддержаны также и методами родителя. Следовательно, массив типа double поддержан методами, применяемыми для виртуального типа данных - numeric.
Переменные в MATLAB. Как и любая среда программирования, MATLAB оперирует с переменными, причём она различает заглавные и прописные переменные. То есть х и Х – совершенно разные переменные.
Переменные не надо объявлять заранее как в стандартных языках, но, как и в них, в среде системы MATLAB некоторые заложенные М-функции возвращают специальные переменные, которые играют важную роль при работе. Например, ans - последний результат, если выходная переменная не указана; pi - cпециальная переменная для числа «пи»: pi=3.141592653589793e+000; inf - специальная переменная для обозначения символа бесконечности; NaN - специальная переменная для обозначения неопределенного значения - результата операций типа: 0/0, inf/inf.
Соответствующие М-функции, генерирующие эти специальные переменные, находятся в каталоге MATLAB/toolbox/matlab/elmat и поддержаны online-подсказкой.
Особенности работы с числовыми массивами.
1) Элемент массива А, расположенный на пересечении строки i и столбца j, обозначается как А(i, j). Если будет сделана попытка обратиться к элементу вне матрицы, то программа выдаст ошибку, если же выполняется присвоение значения элементу с индексами, выходящими за пределы массива, то система MATLAB автоматически увеличивает размер матрицы и неизвестным элементам присваивает значение ноль.
Если в индексных выражениях использовать двоеточие, то можно ссылаться на подблоки массива. Так индексное выражение A(1:k, j) ссылается на блок из k элементов столбца j.
Однако существует способ лучше: двоеточие само по себе ссылается на все элементы строки или столбца: A(:,3).
Кроме того, начиная с версии 5.0, на последнюю строку или столбец массива можно ссылаться с помощью ключевого слова end. Таким образом, оператор A(:, end) описывает последний столбец матрицы А.
3) Операция объединения отдельных подблоков в массив называется конкатенацией. Даже при формировании исходной матрицы, когда объединяются отдельные элементы, осуществляется операция конкатенации. Оператор конкатенации - это пара квадратных скобок [], внутри которых указываются отдельные элементы или блоки массива: B = [A A+32; A+48 A+16], где А - некоторая величина.
4) В системе MATLAB принято хранить каждый массив, независимо от его размерности, как вектор-столбец. Этот вектор образован объединением (конкатенацией) столбцов исходного массива. При обращении к массиву А с указанием единственного индекса происходит непосредственное обращение к этому вектору-столбцу. Обращение A(3) ссылается на третье значение в столбце; А(7) - на седьмое и так далее.
Операторы системы MATLAB. Встроенные функции. Для работы с переменными, числами и др. в системе MATLAB существуют необходимые операторы. Они делятся на три категории:
v Арифметические операторы позволяют конструировать арифметические выражения и выполнять числовые вычисления.
v Операторы отношения позволяют сравнивать числовые операнды.
v Логические операторы позволяют строить логические выражения и имеют самый низкий приоритет относительно операторов отношения и арифметических операторов.
Арифметические операторы допускают использование индексных выражений:
>> D=sqrt(A(2))+2*B(1)
D =
4.8284
Операторы отношения. В системе MATLAB определено 6 следующих операторов отношения:
< Меньше
<= Меньше или равно
> Больше
> = Больше или равно
== Равно тождественно
~ = Не равно
Логические операторы. В состав логических операторов системы MATLAB входят следующие операторы: «&» - и; «|» - или; «~» - нет.
Теперь можно строить выражения, которые используют любую комбинацию арифметических, логических операторов и операторов отношения.
Кроме этих операторов (как и почти в любом языке программирования) существуют четыре основных оператора управления последовательностью исполнения инструкций: 1) оператор условия if, в сочетании с оператором else и elseif выполняет группу инструкций в соответствии с некоторыми логическими условиями; 2) оператор переключения switch, в сочетании с операторами case и otherwise выполняет различные группы инструкций в зависимости от значения некоторого логического условия; 3) оператор условия while выполняет группу инструкций неопределенное число раз, в соответствии с некоторым логическим условием завершения; 4) оператор цикла for выполняет группу инструкций фиксированное число раз. Все операторы управления включают оператор end, чтобы указать конец блока, в котором действует этот оператор управления. Подробнее говорить здесь об этом нецелесообразно, так цель данного раздела – дать общую характеристику математическому пакету MATLAB.
Визуализация результатов вычислений: графика. В результате вычислений в системе МАТLАВ обычно получается большой массив данных, который трудно анализировать без наглядной визуализации. Поэтому система визуализации, встроенная в МАТLАВ, придает этому пакету особую практическую ценность.
МАТLАВ показывает графические объекты в специальных графических окнах, имеющих в заголовке слово Figure (фигура, изображение).
Вот несколько действий, которые позволят добиться необходимой визуализации:
| Действие | Примеры |
| Построить график функции одной вещественной переменной: 1) вычислить массив у значений функции для заданного набора аргументов, 2) вызов функции plot. | >> x=0:0.01:2; >> y=sin(x); >> plot(x,y) |
| Построить два и более графиков в одной системе координат: команда hold on или функция plot(x1,y1,x2,y2,…,xn,yn). Последняя строит графики разным цветом | >> x=0:0.01:2; >> y1=sin(x); y2=cos(x); >> plot(x,y1) >> hold on >> plot(x,y2) >> plot(x,y1,x,y2) |
| Построить в одном графическом окне n графиков: функция subplot (<число рядов подобластей>, <число колонок подобластей>, <номер подобласти вдоль рядов с переходом на новый по окончанию>) перед функцией рlot. | <…> >> subplot(1,2,1); >> plot(x1,y1) >> subplot(1,2,2); >> plot(x2,y2) <…> |
Функции построения графиков, рассмотренные выше, осуществляли вполне приемлемое автоматическое оформление графиков. А сейчас рассмотрим дополнительные возможности, связанные с управлением внешним видом графиков - задание цвета и стиля линий, а также размещение различных надписей в пределах графического окна.
Для изменения стиля линии и дискретных вычисляемых точек можно использовать функцию plot(x1,y1,'s1',x1,y2,'s2',…), которая позволяет объединить в одном графическом окне несколько графиков функций у1(х1), у2(х2),... проведя их со стилями s1, s2,... и т. д. Например, стиль линии определяется следующими маркерами: '-' – непрерывная; '--' – штриховая; ':' - пунктирная; '-.' – штрихпунктирная; цвет линии: 'k' – чёрный; 'r' – красный; 'b' – синий; тип точек: '.' – точка; '+' – плюс; '*' – звезда; 'о' – кружок и т.д.
Примеры.
>> plot(x,y,'o') % вычисляемые точки отмечены кружком
>> plot(x,y,'r+-') % красная непрерывная линия с точками-плюсами
>> plot(x,y,'+r-') % аналогичный результат
>> plot(x,y,'r-',x,y,'ko')
>> plot(x1,y1,'b',x2,y2,'k+')
Если в строке стиля поставить маркер типа точки, но не проставить маркер на тип линии, то тогда отображаются только вычисляемые точки, а непрерывной линией они не соединяются.
Текущее значение любого параметра (атрибута, характеристики) графического объекта можно узнать с помощью функции get. Чтобы ознакомиться со списком всех свойств графического объекта, нужно вызвать функцию get указав ей описатель объекта в виде единственного параметра. Например, для описателя hPlot объекта типа line находим весь список его свойств:
>> x=0:0.1:3;
>> y=sin(x);
>> hPlot=plot(x,y);
>> get(hPlot)
Color = [0 0 1]
EraseMode = normal
LineStyle = -
LineWidth = [0.5]
Marker = none …
Среди всех этих свойств встречаются интуитивно понятные. В частности, мы видим значение толщины линии (LineWidth), равное 0,5; свойство Соlor отвечает за цвет линии: он равен [0 0 1] (RGB-кодировка, то есть Красный Зеленый Синий), что соответствует синему цвету. Для успешного применения иных свойств требуется их подробное и кропотливое изучение, без которого, однако, вполне можно обойтись, так как наиболее важным свойствам система МАТLАВ присваивает по умолчанию вполне в среднем приемлемые значения. Они указываются в списке свойств справа от знака равно. Некоторые свойства не задействованы и являются резервом, который применяют в специальных случаях.
Теперь от оформления непосредственно линий перейдем к оформлению осей координат, к надписям на осях и т. д. Система МАТLАВ устанавливает пределы на горизонтальной оси равными тем значениям, что указаны пользователем для независимой переменной. Для зависимой переменной по вертикальной оси МАТLАВ самостоятельно вычисляет диапазон изменения значений функции. В результате график функции оказывается как бы вписанным в прямоугольник.
Если мы хотим отказаться от этой особенности масштабирования при построении графиков в системе МАТLАВ, то мы должны явным образом навязать свои пределы изменения переменных по осям координат. Это делается с помощью функции ахis([хmin, хmax, уmin, уmax]), причем команду на выполнение этой функции можно вводить с клавиатуры сколько угодно раз уже после построения графика функции, чтобы, глядя на получающиеся визуальные изображения, добиться наилучшего восприятия. Такое масштабирование позволяет получить подробные изображения тех частей графика, которые вызывают наибольший интерес в конкретном исследовании.
Теперь изменим количество числовых меток на осях. Их может показаться недостаточно. Изменить отметки на осях координат можно с помощью функции set обрабатывающей графический объект axes. Это объект, который содержит оси координат и белый прямоугольник, внутри которого проводится график функции. Для получения описателя такого объекта применяют функцию gca. Эту функцию вызывают без параметров. В итоге фрагмент кода
>> hAxes=gca;
>> set (hAxes,'xtick',[1.5 1.75 2.0 2.25 2.5])
выполняющийся после построения графика, устанавливает новые метки (в количестве пяти штук) на горизонтальной оси координат.
Кроме того, используя команду grid on можно нанести измерительную сетку на всю область построения графика.
Для проставления различных надписей на полученном рисунке применяют функции xlabel, ylabel, title и text. Функция xlabel предназначена для проставления названия горизонтальной оси, функция уlabel - то же для вертикальной оси.
Если требуется разместить надпись в произвольном месте рисунка, применяем функцию text, имеющую свои свойства: text (x,y,'some text'), где x,y – координаты точки, с которой начинается надпись. По умолчанию координаты задаются в тех же единицах измерения, что и координаты, указанные на горизонтальной и вертикальной осях. Специальные управляющие символы вводятся внутри текста после символа \ (обратная косая черта). Обозначения для специальных символов совпадают с таковыми в системе подготовки научных текстов ТеХ. В частности, для вывода части текста в следующую строку применяется управляющий символ newline.
Общий заголовок для графика проставляется функцией title ('some text'), так же используемой язык TeX.
Завершая рассказ о способах оформления графиков функций, изменим цвет фона, на котором эти графики рисуются. По умолчанию этот цвет белый. Сделаем его слегка зеленоватым, присвоив цветовому свойству объекта типа ахеs значение [0.5 0.8 0.5]. Но сначала надо получить описатель этого объекта:
>> hAxes=gca;
Функция gca предназначена для поиска описателя текущего объекта ахеs. Так как у нас имеется единственный объект ахеs, то проблемы выбора нет. Если бы было несколько областей, в которых рисуются графики функций, то есть несколько объектов типа ахеs, то в этом случае сначала нужно щелкнуть мышью на том из них, который должен стать текущим, и только после этого вводить представленный выше код.
Сменить цвет фона легко:
>> set (hАхеs, 'Со1ог', [ 0.5 0.8 0.5]);
Аналогично меняем цвет фона всего графического окна:
>> FigureColor = [ 0.8 0.5 0.5]; hFigure = gcf;
>> Set (hFigure, 'Соlоr', FigureColor);
где с помощью функции gcf мы получаем описатель объекта типа figure, представляющего графическое окно, а далее меняем цвет его фона на красноватый.
Кроме двухмерной графики в систему MATLAB входят широкие возможности отображения трехмерных графических объектов. В частности, имеется возможность решать разнообразные задачи трехмерного моделирования объектов реального мира, опираясь на графические объекты типа рatch. Это исключительно обширный и непростой раздел современной компьютерной графики.
Графики функций двух переменных представляют собой куски поверхностей, нависающие над областями определения функций. Отсюда ясно, что изображение графиков функций двух переменных требует реализации «трехмерной графики» на плоском экране дисплея компьютера.
Высокоуровневая графическая подсистема МАТLАВ автоматически реализует трехмерную графику без специальных усилий со стороны пользователя. Пусть в точке с координатами х1, у1 вычислено значение функции z=f(x,y) и оно равно z1. В некоторой другой точке (то есть при другом значении аргументов) х2, у2 вычисляют значение функции z1. Продолжая этот процесс, получают массив (набор) точек (х1,у1,z1), (х2,у2,z2),…, (хN,уN,zN) в количестве N штук, расположенных в трехмерном пространстве. Специальные функции системы МАТLАВ проводят через эти точки гладкие поверхности и отображают их проекции на плоский дисплей компьютера.
Чаще всего точки аргументов расположены в области определения функции регулярно в виде прямоугольной сетки (матрицы точек). Такая сетка точек порождает две числовые матрицы одной и той же структуры: первая матрица содержит значения первых координат этих точек (х-координат), а вторая матрица содержит значения вторых координат (у-координат). Обозначим первую матрицу как Х, а вторую - как У. Есть еще и третья матрица - матрица значений функции z=f(x,y) при этих аргументах. Эту матрицу обозначим буквой Z.
В результате, для построения таких графиков вызов функции plot3 осуществляется в виде
>> рlot3(Х, У, Z)
где X, У и Z - матрицы одинаковых размеров, смысл которых мы только что объяснили.
В системе МАТLАВ имеется специальная функция для получения по одномерным массивам u, v двумерных массивов Х и У, представляющих первые и вторые координаты получающейся прямоугольной сетки точек: [X, У] = meshgrid(u,v) (примеры графиков см. в решении задач).
Таким образом, функция рlot3 строит график в виде набора линий (тип line) в пространстве, каждая из которых является сечением трехмерной поверхности плоскостями, параллельными плоскости уОz. По-другому можно сказать, что каждая линия получается из отрезков прямых, соединяющих набор точек, координаты которых берутся из одинаковых столбцов матриц X, У и Z. То есть, первая линия соответствует первым столбцам матриц X, У, Z; вторая линия - вторым столбцам этих матриц и т. д.
Помимо этой простейшей функции система МАТLАВ располагает еще рядом функций, позволяющих добиваться большей реалистичности в изображении трехмерных графиков. Это функции mesh, surf и surfl. Они порождают графические объекты типа surface.
Функция mesh и соединяет друг с другом все соседние точки поверхности графика отрезками прямых и показывает в графическом окне системы МАТLАВ плоскую проекцию такого объемного каркасно-ребристого (по-английски – wireframe mesh) тела. Каркасно-ребристое тело состоит из четырехугольных граней белого цвета, а ребра граней окрашиваются в разные цвета. По умолчанию более высоким точкам графика соответствуют красные цвета, а более низким (меньшие значения третьей координаты) - темно-синие. Промежуточные области окрашиваются в светло-синие, зеленые и желтые цвета. В результате, поскольку разные области поверхности графика (конкретно - ребра каркасного тела) окрашиваются в разные цвета, применение функции mesh порождает весьма наглядное изображение трехмерного графика.
Как мы уже говорили, для лучшего восприятия «объемности изображения» разные ребра автоматически окрашиваются в разные цвета. Если вы считаете, что изображенное ребристое тело является прозрачным и не должно скрывать задних ребер, то можно ввести команду hidden off, после чего такие линии появятся на изображении. В одних случаях это позволяет улучшить изображение, в других - нет. Всегда можно вернуться к имеющему место по умолчанию режиму сокрытия при помощи команды hidden on.
Более «плотного» изображения поверхности можно добиться за счет раскраски разными цветами не ребер, а граней каркасно-ребристого тела. Для этого вместо функции mesh нужно применить функцию surf: surf (X, У, Z). В результате получается изображение, представляющее плотную (непрозрачную) сетчатую поверхность, причем отдельные ячейки (грани) этой сетчатой поверхности (плоские четырехугольники) автоматически окрашиваются в разные цвета.
Функция surfl в отличие от функции surf не применяет искусственных приемов закраски поверхности трехмерных графиков. Упрощённо говоря, эта функция сразу же использует понятие освещения поверхности графика. По умолчанию она использует встроенную засветку графика со стороны некоторой геометрической точки пространства. В результате точки поверхности графика, обращенные в сторону источника света (условно более яркие), изображаются красным цветом, а точки, находящиеся «в тени», - темно-синим.
Что касается оформления трёхмерных графиков, то многие приёмы совпадают с теми, что были рассмотрены при изучении плоских графиков: axis([xmin xmax ymin ymax zmin zmax]), text, xlabel, ylabel, zlabel и т.д.
Отличие состоит только в существовании для трёхмерной графики камеры и свойств её объектива. Главное из характеристик камеры – её положение. Оно определяется двумя углами, задающими ориентацию этой точки в пространстве: угол азимута (часто обозначают как az) и угол возвышения (обозначают el). Изменение первого угла означает вращение плоскости хОу вокруг оси Оz против часовой стрелки. Угол возвышения есть угол между направлением на точку обзора и плоскость хОу.
Когда выполняются высокоуровневые графические функции mesh, surf или surfl, то по умолчанию устанавливаются значения az=-37.5º, el=30º. Эти значения в любой момент времени можно изменить специальной функцией view([az,el]), где аргументы – новые углы.
Подводя итоги, заметим, что система MATLAB обладает огромными, трудно поддающимися обзору возможностями по оформлению графиков функций. Все рассмотренные возможности основаны на так называемой векторной графике, когда изображаемый объект задан своими координатами (числовыми данными, накопленными в массивах), которые сама система MATLAB в момент отображения переводит в значения (цвет) пикселов дисплея. Векторная графика прекрасно поддаётся масштабированию (что наглядно показано на рисунках в работе).
Однако существуют графические объекты реального мира, заданные в растровой форме, например сосканированные для ввода в компьютер фотографии. Система MATLAB обладает также развитыми средствами работы с растровой графикой.
Кроме этого, в MATLAB существуют возможности по показу движущихся векторных изображений (например, динамическое построение графика, вращение трёхмерных графиков, изображение «броуновского движения»), что важно для визуализации динамических данных и для всестороннего изучения 30-объектов. Но мультимедийные способности пакета МАТLАВ базируются не только на анимации, но и на возможности воспроизводить звук (если на компьютере присутствует соответствующее оборудование) стандартного для платформы Windows формата WAVE (*.wav).
Аналитические вычисления с помощью пакета расширения Symbolic Math Toolbox. Сколь широки ни были бы возможности ядра системы МАТLАВ по предоставлению готовых услуг в области вычислений и компьютерной графики, всегда найдутся новые частные проблемы и целые предметные области, которые остались неохваченными.
Для гибкого реагирования на такие ситуации архитектура пакета МАТLАВ построена таким образом, что имеется очень удобная техника встраивания в общую систему новых программных решений. Причем это встраивание происходит прозрачным (незаметным) для пользователя образом. После инсталляции пакета расширения (по-английски - tооlbох) функциональные возможности этого пакета как бы сливаются с базовыми возможностями ядра системы МАТLАВ и ими становится возможным пользоваться абсолютно традиционными способами.
Пакеты расширения для системы МАТLАВ производят как фирма-изготовитель самого пакета МАТLАВ, так и сторонние производители. В настоящее время существуют десятки официально распространяемых пакетов расширения, среди которых существуют специальные математические пакеты для решения систем дифференциальных уравнений с частными производными (пакет Partial Differential Equations Тооlbох), для решения задач статистики (Statistics Тооlbох) и оптимизационных задач (Оptimization Тооlbох), дла решения задач обработки изображений (Image Processing Тооlbох; Wavelet Toolbox) и многих других задач.
Рассмотрим только основные возможности пакета расширения Symbolic Math Тооlbох, позволяющего в рамках системы МАТLАВ осуществлять аналитические вычисления и аналитические преобразования выражений. Этот пакет лицензирован у фирмы Waterloo Марlе Software, Canada, и включен в состав дистрибутива пакета МАТLАВ на правах пакета расширения. Он столь органично дополняет и расширяет возможности ядра системы МАТLАВ, что пропустить рассказ об этом пакете расширения было бы неверно. Возможности пакета Symbolic Math Тооlbох поистине гигантские, поэтому мы остановимся лишь на основных и наиболее характерных из них.
Помимо выполнения аналитических преобразований пакет Symbolic Math Тооlbох позволяет выполнить арифметические вычисления с контролируемой точностью, которую можно заказать заранее. С этого и начнем.
Пакет расширения Symbolic Math Тооlbох предоставляет для этой цели две функции - digits и vpa. Первая из этих функций устанавливает требуемую точность в количестве верных десятичных знаков после запятой, а вторая функция осуществляет вычисления с заданной точностью. Аббревиатура vpa означает Variable Precision Arithmetic, что переводится как «арифметика с переменной точностью».
Пример.
>> digits(30); vpa(pi)
ans = 3.14159265358979323846264338328
В примере получили прекрасный результат - число  с 30 значащими знаками, при чём ответ ans оказался принадлежащим новому классу – sym object. Другими словами Symbolic Math Тооlbох работает с данными нового типа – с символьными объектами.
y1=y; s2=['n=' num2str(n)]; hText=text(1.5, 1.5^2*n-1, s2); set(hText,'FontSize',[14]); end
Пример. Построить семейство функций  (
( ) и найти их общие точки, причём в объекте Figure подписать графики и точки, обозначить оси, подписать заголовок и использовать разные цвета для построенных графиков. При решении использовать функцию num2str(x), переводящее число x в строковую величину:
>> x=-2:0.1:2;
title('{\itf(x)=x^{n}}');
xlabel('x');
ylabel('y');
hFigure=gcf;
set(hFigure,'Color',[1 1 1]);
hText=text;
set(hText,'FontSize',[18]);
for n=2:4
y=x.^n;
hold on
hPlot=plot(x,y);
set(hPlot,'Color',[1.8/n 0.7 0.5]);
set(hPlot,'LineWidth',2);
if n~=2
for i=1:length(y)
s='';
if y(i)==y1(i)
hold on
plot(x(i),y(i),'ko');
s=['(' num2str(x(i)) ',' num2str(y(i)) ')'];
hText=text(x(i),y(i)+2, s); set(hText,'FontSize',[16]);
end
end
end
y1=y; s2=['n=' num2str(n)];
hText=text(1.5, 1.5^2*n-1, s2); set(hText,'FontSize',[14]);
end

Рис. 12
Лабораторная работа 1
Математика и вычисления
В клиентской части командного окна MATLAB после знака приглашения можно вводить различные числа, имена переменных и знаки операций, что в совокупности составляет некоторые выражения.
Пример 1. Нажатие клавиши Enter заставляет систему MATLAB вычислить выражение или, если оно не вычисляется, повторить его. Хотя знак «;» в конце строки гасит вывод результата (эхо-вывод).
>> a=2
a =
>> b=4;
>> с=a+b
с =
Таким образом, в клиентской части командного окна MATLAB пользователь может сразу писать команды, образующие отдельные вычисления или целую программу.
Пример 2. Вычислить выражение с извлечением квадратного корня:
>> r =(1+sqrt(5))/2
r =
1.6180
Пример 3. Создание нулевой матрицы размера (2,4):
>> Z=zeros(2,4)
Z =
0 0 0 0
0 0 0 0
Пример 4. Матрицы можно вводить непосредственно. Точка с запятой используется для разделения строк матрицы.
>> A=[1 2 3;4 5 6;7 8 9]
A =
1 2 3
4 5 6
7 8 9
Пример 5. Квадрат каждого элемента матрицы:
>> A.^2
ans =
1 4 9
16 25 36
49 64 81
Пример 6. Сложение и умножение матриц:
>> A=[1 2 3;4 5 6;7 8 9]; B=2*A; C=A+B
C =
3 6 9
12 15 18
21 24 27
Пример 7. Создание матрицы, каждый элемент которой является cos от С:
>> cos(C)
ans =
-0.9900 0.9602 -0.9111
0.8439 -0.7597 0.6603
-0.5477 0.4242 -0.2921
Пример 8. Вычисление сложной функции:
>> x=2;y=(sin(2*x)-tan(7.8*x^2)/cos(3*x^4))*exp(-2*x)
y =
-0.0201
Лабораторная работа 2

