


1. Цель работы:
1.1. изучение возможностей п остроения диаграмм средствами VBA.
1.2. Изучение принципов создания различных приложений.
2. Приборы и оборудование:
2.1. Методические указания.
2.2. ПЭВМ типа IBM PC/XT.
2.3. MS Word.
2.4. Visual Basic for Application.
3. Порядок выполнения работы:
3.1. Изучить основные теоретические сведения (Приложение А).
3.2. Задание 1. В диалоговое окно «Построение графика» (см. приложение А. рисунок 1) вводятся начальное, конечное значения аргумента и его шаг изменения. Уравнение графика жестко регламентировано. Программа сама переведет аргумент в ссылку на ячейку. После табуляции введенной функции программой и построения поверхности на рабочем листе этот график также отображается в объекте управления image, расположенном в диалоговом окне Построение графика (см. рисунок 1, 2).
3.3. Задание 2. В диалоговое окно «Построение графика» (см. рисунок 3) вводятся начальное, конечное значения аргумента и его шаг изменения. Уравнение графика вводится в текстовое окно. Программа сама переведет аргумент в ссылку на ячейку. Предусматривается выбор типа графика при построении графика функции. После табуляции введенной функции программой и построения поверхности на рабочем листе этот график также отображается в объекте управления image, расположенном в диалоговом окне Построение графика (см. рисунок 3, 4, 5).

Рисунок 1 – Построение графика в диалоговом окне при выборе у=cos(x)

Рисунок 2 – Построение графика в диалоговом окне при выборе у=sin(x)

Рисунок 3 – Построение графика в диалоговом окне при выборе линейного типа

Рисунок 4 – Построение графика в диалоговом окне при выборе гистограммы

Рисунок 5 – Построение графика в диалоговом окне при выборе круговой диаграммы
3.4. Задание 3. Напишите программу переноса данных из таблицы Microsoft Excel, созданной в лабораторной работе №7, в автоматически создаваемый документ Microsoft Word, пример оформления формы:

Рисунок 6 – Разработанная форма в рабочем состоянии.
3.5. Создайте кнопку или панель в Вашем проекте для непосредственного вызова приложения.
3.6. Добавьте комментарии. Текст и результат выполнения программы занести в отчёт.
3.7. Сформулируйте выводы по проделанной работе.
4. Содержание отчёта:
4.1. Тема работы.
4.2. Цель работы.
4.3. Приборы и оборудование.
4.4. Порядок выполнения работы.
4.5. Выводы.
4.6. Контрольные вопросы.
5. Контрольные вопросы:
5.1. Как считать заголовочные данные и вывести их в ячейки электронной таблицы?
5.2. Как выполнить автозаполнение с текущей строки таблицы на следующую строку?
5.3. Язык макрокоманд VBA. Работа с диаграммами.
5.4. Как заменить в введенной формуле аргумента х на ссылку $A1?
5.5. Как создать стандартное приложение Word?
5.6. Как создать объект Word?
5.7. Как осуществить активацию приложения?
5.8. Как осуществить добавление приложения и перенести данные в приложении?
5.9. Как VBA осуществляется передача данных из Excel в текстовый документ?
Приложение А
Теоретические сведения
Построение диаграмм
Диаграммы в Excel
Диаграммы можно размещать на рабочем листе. Для этого используется коллекция chartobjects. Ее элементы – объекты класса chartobject – являются контейнерами, содержащими объект Chart, задающий непосредственно диаграмму.
Методы объекта Chart
Рассмотрим основные методы, определяющие новое поведение объекта Chart:
SubChartWizard ([Source], [Gallery], [Format], [PlotBy], [CategoryLabels], [SeriesLabels], [HasLegend], [Title], [CategoryTitle], [ValueTitle], [Extra-Title])
Этот метод позволяет построить или модифицировать существующую диаграмму. В отличие от мастера диаграмм (ChartWizard), который вызывается при построении диаграммы вручную, метод не является интерактивным, более того, он не позволяет задать все возможные свойства. С его помощью можно выполнить основную работу, а детали строятся с использованием других свойств и методов объекта Chart. Все параметры метода являются необязательными:
1) Source – объект Range, содержащий исходные данные для построения новой диаграммы. Если параметр опущен, то метод позволяет отредактировать существующую диаграмму – либо выделенную диаграмму рабочего листа, либо диаграмму активного листа диаграмм.
2) Gallery – задает тип диаграммы и может быть одной из следующих констант: xlArea, xlBar, xlColumn, xlLine, xlPie, xlRadar, xlXY-Scatter, xlCombination, xl3DArea, xl3DBar, xl3DColumn, xl3DLine, xl3DPie, xl3DSurface, xlDoughnut, или xlDefaultAutoFormat.
3) Format – задает формат для данного типа диаграммы. Каждому типу диаграммы соответствует некоторое число возможных форматов. Параметр задает номер формата, по умолчанию выбирается первый формат данного типа.
4) PlotBy – соответствует терминальному свойству PlotBy.
5) CategoryLabels и SeriesLabels – целые, указывающие число строк или столбцов с метками категорий и рядов данных в области, заданной параметром Source. Указывать эти числа нужно на единицу меньше фактического значения.
6) Остальные параметры позволяют добавить легенду, задать название диаграммы и ее осей – они совпадают с соответствующими терминальными свойствами.
Sub SetSourceData (source as range, [plotby]). Устанавливает источник данных диаграммы. Второй параметр соответствует терминальному свойству plotby.
SubApplyCustomType (ChartTypeAsXlChartType, [typename]). Метод позволяет модифицировать диаграмму, применив к ней новый тип – стандартный или настраиваемый. Если этот тип стандартный, то тогда первый параметр полностью его определяет. Его возможные значения совпадают со значениями соответствующего терминального свойства charttype. Если же тип настраиваемый, то первый параметр должен иметь одно из следующих значений: xlbuiltin, xluserdefined или xlanygallery. В этом случае второй параметр задает имя типа диаграммы.
Function Export (filename as string, [filtername], [interactive]) as boolean позволяет экспортировать диаграмму, преобразуя ее в графический формат. Первый параметр задает имя файла, в который будет записана диаграмма в графическом формате, второй – задает имя графического фильтра в том виде, как оно записано в системном регистре. Булев параметр interactive должен иметь значение true, если мы хотим вызвать диалоговое окно в процессе фильтрации. Функция export возвращает значение true в случае успешного завершения работы.
Sub GetChartElement (x as long, y as long, elementid as long, argl as long, arg2 as long). Представьте себе, что пользователь щелкнул кнопку мыши где-то над диаграммой. Обработав это событие, можно получить координаты курсора мыши – x и y. Если теперь вызвать метод getchartelement с этими координатами, то он вернет значение параметра elementid – идентификатор элемента диаграммы и значения двух параметров, связанных с этим элементом. Конечно, параметры зависят от типа того элемента, чьи координаты x и y заданы.
Function Location (where as xlchartlocation, [name]) as
Chart. Передвигает диаграмму в новое местоположение. Параметр Where имеет следующие значения: xlLocationAsNewSheet, xlLocationAsObject или xlLocationAutomatic.
В первом случае диаграмма помещается на новый лист диаграммы и параметр Name задает имя этого листа. Во втором случае диаграмма помещается как встроенный объект и Name задает имя рабочего листа.
Создание VBA-программы. Пример. По введенным в диалоговое окно «Построение графика» (см. рисунок 1) начальным, конечным значениям аргументов и их шагам изменения строится график. Уравнение графика также вводится в программу из диалогового окна. Уравнение должно быть составлено в соответствии с правилами, по которым строятся функции рабочего листа, но в качестве аргументов в нем следует использовать х вместо ссылки на ячейку. Программа сама переведет аргумент в ссылку на ячейку. После табуляции введенной функции программой и построения поверхности на рабочем листе (см. рисунок 2) этот график также отображается в объекте управления Image, расположенном в диалоговом окне Построение графика (см. рисунок 1).
Технология выполнения
Обсудим, как приведенная ниже программа решает описанную задачу и что происходит в ней.

Рисунок 1 – Диалоговое окно «Построение графика» в рабочем состоянии (пример)
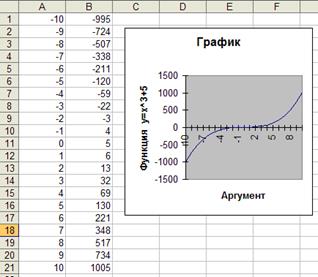
Рисунок 2 – Результат построения графика на рабочем листе (пример)
UserForm_Initialize
1. Активизирует диалоговое окно.
2. Назначает клавише <Esc> функцию кнопки Отмена, а клавише <Enter> – построение.
3. Устанавливает, чтобы отображаемая картинка графика в диалоговом окне помещалась целиком и пропорционально в пределах элемента управления Image, а также чтобы левый верхний угол рисунка совпадал с левым верхним углом элемента управления Image.
Нажатие кнопки Построение запускает на выполнение процедуру CommandButton1__C1ick
1. Проверяет, являются ли вводимые данные числами. В случае ошибки отображается соответствующее сообщение.
2. Проверяет согласованность вводимых данных. В случае ошибки отображается соответствующее сообщение (см. рисунок 3).
3. Преобразует формулу, введенную в поле Уравнение графика, в формулу рабочего листа.
4. Проверяет корректность введенной формулы. В случае ошибки отображается соответствующее сообщение (см. рисунок 4).
5. Используя метод DataSeries, начиная с ячейки А2, строит вниз по столбцу арифметическую прогрессию, являющуюся результатом табуляции аргумента х уравнения графика с указанными шагами (рисунок из файла graph.jpg в элементе управления Image1).

Рисунок 3 – Пример сообщения о несогласованности данных

Рисунок 4 – Сообщение о некорректном вводе формулы
Нажатие кнопки Отмена запускает на выполнение процедуру CommandButton2_C1ick
Закрывает диалоговое окно.
Рассмотрим листинг данного приложения.
Private Sub CommandButton1_Click()
' Процедура табуляции функции
Dim х_нз As Double
Dim х_пз As Double
Dim х_шаг As Double
Dim УрГрафика As String
Dim nx As Integer
'nx – число протабулированных значений аргумента х
Dim n As Integer
Dim i As Integer
'n,i – вспомогательные целые переменные
'Проверка корректности ввода данных
If IsNumeric(TextBox2.Text) = False Then
MsgBox «Ошибка в начальном значении х», vbInformation, «График»
TextBox2.SetFocus
Exit Sub
End If
If IsNumeric(TextBox3.Text) = False Then
MsgBox «Ошибка в шаге х», vbInformation, «График»
TextBox3.SetFocus
Exit Sub
End If
If IsNumeric(TextBox4.Text) = False Then
MsgBox «Ошибка в конечном значении у», vbInformation, «График»
TextBox4.SetFocus
Exit Sub
End If
'Считывание с диалогового окна значений переменных
х_нз = CDbl(TextBox2.Text)
х_шаг = CDbl(TextBox3.Text)
х_пз = CDbl(TextBox4.Text)
УрГрафика = Trim(TextBox1.Text)
'Проверка согласованности введенных данных
If х_нз >= х_пз Then
MsgBox «Начальное значение х слишком большое», vbInformation, «График»
TextBox2.SetFocus
Exit Sub
End If
If х_нз + х_шаг >= х_пз Then
MsgBox «Шаг х великоват», vbInformation, «График»
TextBox3.SetFocus
Exit Sub
End If
'Замена в введенной формуле аргумента х на ссылку $A1
i = 1
Do
'Замена в введенной формуле аргумента х на ссылку $A1
If Mid(УрГрафика, i, 1) = «x» Or Mid(УрГрафика, i, 1) = «X» Then
n = Len(УрГрафика)
If (1 < i) And (i < n) Then
УрГрафика = Left(УрГрафика, i – 1) & «$A1» & Right(УрГрафика, n – i)
End If
If i = 1 Then
УрГрафика = «$A1» & Right(УрГрафика, n – 1)
End If
If i = n Then
УрГрафика = Left(УрГрафика, n – 1) & «$A1»
End If
End If
i = i + 1
Loop While i <= Len(УрГрафика)
ActiveSheet.Cells.Select
Selection.Clear
'Очистка на активном листе ранее введенных данных
ActiveSheet.Range(«A1»).Select
'Заполнение диапазонов значениями аргумента
With ActiveSheet
Range(«A1»).Value = х_нз 'Ввод в ячейку A1 начального значения
'Создание арифметической прогрессии по столбцу с указанным шагом и начальным значением
Range(«A1»).DataSeries Rowcol:=xlColumns, Type:=xlLinear, Step:=х_шаг, Stop:=х_пз, Trend:=False
End With
'Заполнение диапазона значениями функции
With ActiveSheet
nx = Range(«A1»).CurrentRegion.Rows.Count
'Определение числа строк в диапазоне заполнения
Range(«B1»).FormulaLocal = УрГрафика
'Ввод уравнения поверхности в ячейку B1
If IsError(Evaluate(УрГрафика)) = True Then
MsgBox «Ошибка в формуле», vbExclamation, «График»
Exit Sub
End If
'Заполнение диапазона Range(Cells(1, 2), Cells(nx, 2))
'начиная с ячейки B1, что эквивалентно протаскиванию маркера
'заполнения ячейки B1 на диапазон Range(Cells(1, 2)
Cells(nx, 2))
Range(«B1»).AutoFill Destination:=Range(Cells(1, 2), Cells(nx, 2)), Type:=xlFillDefault
End With
ActiveSheet.ChartObjects.Delete
'Удаление с рабочего листа всех ранее построенных диаграмм
ActiveSheet.Range(Cells(1, 2), Cells(nx, 2)).Select
'Выбор диапазона, по которому строится график
ActiveSheet.ChartObjects.Add(20, 19.5, 192, 192).Select
'Задание и выбор области на рабочем листе, где будет построен график,
'размер графика должен соответствовать размеру объекта Image1
Application.CutCopyMode = False
'Построение графика
ActiveChart.ChartWizard Source:=Range(Cells(1, 1), Cells(nx, 2)), Gallery:=xlLine, Format:=2, PlotBy:=xlColumns, CategoryLabels:=1, SeriesLabels:=0, HasLegend:=False, Title:="График",
CategoryTitle:="Аргумент", ValueTitle:="Функция y" & TextBox1.Text
ActiveSheet.ChartObjects(1).Activate
ActiveChart.Axes(xlValue).AxisTitle.Select
With Selection
HorizontalAlignment = xlCenter
VerticalAlignment = xlCenter
Orientation = xlUpward
End With
'Запись диаграммы в файл и загрузка картинки в Imagel
ActiveChart.Export Filename:="Graph.jpg",
FilterName:="JPEG"
UserForm1.Image1.Picture = LoadPicture(«graph.jpg»)
ActiveSheet.Range(«A1»).Select
End Sub
Private Sub CommandButton2 Click()
'Процедура закрытия диалогового окна
UserForm1.Hide
End Sub
Private Sub UserForm Initialize()
'Рисунок масштабируется с учетом относительных размеров так, чтобы он помещался в объекте Imagel
With Imagel
PictureAlignment = fmPictureAlignmentTopLeft
PictureSizeMode = fmPictureSizeModeStretch
End With
End Sub
Разработка приложений
Очень часто при работе в Excel возникает необходимость выделить какие-то определенные строки и отправить их в документ Microsoft Word, например, для печати.
Так стандартное приложение Word создаётся:
Dim AppWord As Word.Application
Dim i As Long
Cоздается объект Word
Set AppWord = CreateObject("Word.Application")
Для активации приложения:
AppWord.Visible = True
Для добавления приложения:
AppWord.Documents.Add
Для переноса данных на Ваше усмотрение
Range("A5:G5").Copy
Для выделения и вставки
AppWord.Selection.Paste
Для самостоятельного задания значений, данный ввод можно автоматизировать
For i = 6 To 10
If Cells(i, 18) = True Then ' условие если...
Range(Cells(i, 1), Cells(i, 16)).Copy
AppWord.Selection.Paste 'выделение, вставка
End If 'конец блока else
Next
Application.CutCopyMode = False
Для окончания работы с приложением Word
Set AppWord = Nothing
End Sub
[1] Вычислительный центр…
[2] Для ввода данных использовать встроенную функцию InputBox.
[3] Для вывода результатов использовать встроенную функцию MsgBox.
[4] Неопытность начинающего программиста выдает то, что получив задание, он практически сразу садится писать исходный код. Такой подход в корне не правильный, так как приводит к множественному переписыванию текста программы. Не спешите кодировать - это самое простое в разработке программ. Начните с проектирования: обдумайте что, зачем и как должна делать ваша будущая программа. Поищите решения аналогичных задач. Составьте общий алгоритм вашей программы. Не стесняйтесь показать свою неопытность: программисты обычно достаточно лояльны к молодым коллегам и скорее всего помогут вам, самое меньшее советом. А вот потом можно приниматься непосредственно за кодирование.
[Ю1]Номер лабораторной работы
[Ю2]Порядковый номер студента

