Покажем, как производится разделение различных групп цветов на основе классификации по принципу ближайшей окрестности и их отображение в системе 'a*' и 'b*'.
purple=[119/255 73/255 152/255];plot_labels={'k', 'r', 'g', purple, 'm', 'y'}; figurefor count=1:nColors plot(a(label==count-1),b(label==count-1),'.','MarkerEdgeColor',... plot_labels{count}, 'MarkerFaceColor', plot_labels{count}); hold on;end title('Размещение сегментированных пикселей в пространстве ''a*b*'' ');xlabel('''a*'' values');ylabel('''b*'' values');
 Обнаружение вращений и масштабных искажений на изображении
Когда известна информация относительно искажений изображения, которые заключаются в вращении и изменении масштаба, тогда для обработки применяют функцию cp2tform. Эта функция служит для восстановления изображений.
Содержание: · Шаг 1: Считывание изображения.· Шаг 2: Изменение размеров изображения.· Шаг 3: Вращение изображения.· Шаг 4: Выбор контрольных точек.· Шаг 5: Предварительные преобразования.· Шаг 6: Определение масштаба и угла.· Шаг 7: Восстановление изображения.
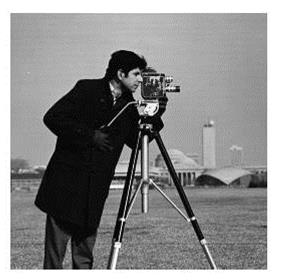
Шаг 1: Считывание изображения. Считаем изображение в рабочее пространство.I=imread('cameraman.tif');imshow(I)
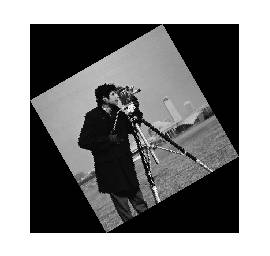
Шаг 2: Изменение размеров изображения. scale=0.6;J=imresize(I, scale); % Изменение масштаба.
Шаг 3: Вращение изображения. theta=30;K=imrotate(J, theta); % Изменение угла.figure, imshow(K)
Шаг 4: Выбор контрольных точек. Выберем контрольные точки с помощью Control Point Selection Tool. input_points=[129.87 141.25; 112.63 67.75];base_points=[135.26 200.15; 170.30 79.30];cpselect(K,I, input_points, base_points); Запишем контрольные точки, выбирая в меню File опцию Save Points to Workspace. Также перезапишем переменные input_points и base_points.
Шаг 5: Предварительные преобразования. Найдем структуру TFORM, которая согласуется с контрольными точками. t=cp2tform(input_points, base_points, 'linear conformal'); После выполнения шагов 6 и 7, снова повторяются шаги 5-7, только взамен опции 'linear conformal' используется 'affine'. Это приводит к улучшению результатов.
Шаг 6: Определение масштаба и угла. Структура TFORM содержит матрицу преобразований t.tdata.Tinv. После того как стали известны типы искажений (вращение и масштабирование), проводят операции по восстановлению масштаба и угла. Let sc=s*cos(theta)Let ss=s*sin(theta)Тогда, Tinv=t.tdata.Tinv=[sc -ss 0; ss sc 0; tx ty 1]где параметры tx и ty являются сдвигом по x и y соответственно.ss=t.tdata.Tinv(2, 1);sc=t.tdata.Tinv(1, 1);scale_recovered=sqrt(ss*ss+sc*sc)theta_recovered=atan2(ss, sc)*180/pi
scale_recovered= 0.6000theta_recovered= 29.3699 Итак, значение параметра scale_recovered находится в пределах 0.6, а значение параметра theta_recovered около 30.


