


Пример №1
Вычислим порог для критерия Котельникова:


Для аналитического обнаружения порога рассмотрим:


Пример №2
Обнаружить цель двумя РЛС (радиолокационная станция) независимо. Априорная вероятность обнаружения цели 1-й станции равна 0,7; 2-й равна 0,8. Нужно определить вероятность обнаружения хотя бы одной станции.
Решение: В таких задачах зондирующий импульс детерминированный, случайная помеха отсутствует. Нет необходимости вычислять правдоподобие. Задача сводится к вычислению элементарных событий. Соответственно, вероятность обнаружения:
P(A) = 0,7
P(B) = 0,8
P(AB)= P(A)*P(B) = 0,7*0,8 = 0,56
P(C) = P(A+B)=P(A) + P(B) – P(AB) = 0,7+0,8-0,56= 0,94 или

Ответ: вероятность обнаружения одной станции P (C)= 0,94.
Пример№3:
Генерируется два сигнала и расстояние наблюдается на интервале от 0 до t, скважность между двумя импульсами равна  , вводится ограничение: если разница
  то приемник перегружается и выносит ошибочное решение.
  это случайные моменты поступления любых импульсов поступающих независимо от источника 1 и источника 2. Поступления от источников равновероятные. Задача определить вероятность события Р(А) что приемник будет перегружен.
Решение:
 τ1, τ2 – представляем в виде декартовых координат, а область возможных значений поступлений τ1/τ2 есть T2
Решение задачи сводится к отношению ошибочной и полезной областей, область перезагрузки приемника находится в заштрихованной области. При сближении τ1 и τ2 область перегрузки уменьшается, говоря о высокой разрешающей способности приемника. Площадь заштрихованной области равняется s, тогда искомая вероятность есть отношение:
S= T2
s= T2-(T- τ)2

τ= 0,5 c, P(A)=0,75
Оптимальное обнаружение детерминированного сигнала с учётом критических ошибок.
На вход приёмника поступает либо случайный процесс в виде шума n(t), либо сумма полезного сигнала и помехи f(t).Рассмотрим две гипотезы:1)  сигнал + помеха; 2)
  только помеха.
Априорные вероятности этих гипотез принимаются равновероятными.
Помеха n(t) при стрессовыхГауссовским шумом нулевым и средним и с выборочной дисперсией. В момент времени производится измерение входного процесса и по полученному значению алгоритм принимает решение: был на входе сигнал или не было. Кроме выборочного среднего и выборочной дисперсии иногда используется корреляционный момент. Из-за случайного характера процесса приёма решение в пользу гипотез  и
и  сопровождаются ошибками двух видов: ошибка первого рода (когда отвергается правильная гипотеза) носит название ложная тревога F; ошибка второго рода (когда принимается не правильная гипотеза) носит название пропуск сигнала H.
Пример №4.
Три источника сигнала генерируют на базовую станцию свои сигналы.
Стоит задача определить вероятность потери связи  . Каждый источник из-за воздействия помех может потерять связь с базовой станцией.
Решение:
Назначим априорные вероятности потерь помехоустойчивости по каждому источнику:

Возникает задача проверки гипотез, которые ведут к событию A. Гипотеза  - помехоустойчивость упала у одного источника. Гипотеза
  – помехоустойчивость упала у двух источников. Гипотеза
  – помехоустойчивость снизилась у всех трёх источников.
Предположим, что если помехоустойчивость снизилась у одного из источников, то вероятность потери связи равна 0,25.
Если только у двоих источников, то будет равняться 0,4. Если же у всех трёх, то это число будет 0,5.


Т.е. связь не будет восстановлена.
Ответ: вероятность потери связи 
Пример №5
Апостериорная вероятность гипотез.
По каналу связи передаются сигналы в виде кодовых комбинаций S1 и S0 с априорными вероятностями их передачи P1=0.7 и Р2=0.3. Из-за наличия помех вероятность правильного каждого символа в группе уменьшается до 0.6. Искажения кодовой комбинации происходит независимо друг от друга. Фиксируем прием символов: U=10110
Определить какая команда была передана.
S1=11111 P1=0.7
S0=00000 Р2=0.3
P0=0.6
U=10110 H1→S1
H0→S0
Решение:
P(A(H1))=0,6*0,4*0,6*0,6*0,4=0,035
P(A(H0))=0,4*0,6*0,4*0,4*0,6=0,023
P(H1(A))=  =
= 
P(H0/A)=0,22 → H1
Пример 6
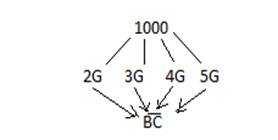
Имеется множество абонентов – 1000, которые разбросаны по терминалам 2G, 3G, 4G, 5G и разбросаны по трем категориям Home, Corp, VIP
 - Абоненты
Абоненты взаимодействуют с БС образуя группу событий:
А1- БС обрабатывает сигнал абонента группы 2G
А2- БС обрабатывает сигнал абонента группы 3G
А3- БС обрабатывает сигнал абонента группы 4G
А4- БС обрабатывает сигнал абонента группы 5G
| Событие А | ||||||
| Событие В | T\G | 2G | 3G | 4G | 5G | Всего |
| H | 50 | 300 | 90 | 0 | 440 | |
| C | 50 | 50 | 0 | 100 | 200 | |
| V | 0 | 150 | 60 | 150 | 360 | |
|
| 100 | 500 | 150 | 250 | 1000 | |
1. Какова вероятность обработки базовой станцией сигнала каждого из 4-х стандартов?
Возможны всего 4 исхода:
Р2G=  =0,1;Р3G=0,5(Р(А)); Р4G=0,15; Р5G=0,25

2. Какова вероятность обработки базовой станцией сигнала любого из 4-х стандартов, но определенной группы?
Возможны всего 3 исхода:
PHome=  ; Рcorp= 0,5; РVIP= 0,36(P(B))
3. Какова вероятность обработки базовой станцией сигнала VIPабонента стандарта 3G? Таких всего 150 человек.
Р(А) = РVIP 3G=  =0,15
=0,15
! Примечание: если это событие Р(А) вычислять как произведение:
Р(АВ) =Р3G*РVIP=0,5*0,36=0,18 ≠ 0,15 следовательно так считать нельзя.
Нужно вычислять условные вероятности Р(А/В)
Р(А/В) = P(3G/VIP)=  =0,417 – Условная вероятность выбора сигнала стандарта 3Gиз группы VIP
P(AB)=P(B)P(A/B)=0,36*0,417= 0,15
Условная вероятность выбора сигнала группы VIPиз стандарта 3G
P(В/А)=  =0,3
=0,3
P(AB)=P(А)P(В/А)=0,5*0,3= 0,15
4. Базовая станция равновероятно обрабатывает сигнал какого-то абонента.
Какова вероятность, что этот сигнал € группе «Home»?
У нас выбор сигнала по 4-м стандартам равновероятен, т.е.
Р(А1)=Р(А2)=Р(А3)=Р(А4)=0,25 – априорные вероятности
P(В)- полная вероятность принадлежности сигнала к группе «Home». >>
>> P(B/A1)=  =0,5; P(B/A2)=
  =0,6; P(B/A3)=
  =0,6; P(B/A4)=
  =0;
=0;
>>Р(В)=  (Аi)Р(В/ Аi)=0,5*0,25+0,6*0,25+0,6*0,25+0*0,25= 0,425
5. Предположим, что принятый(обработанный) сигнал € группе Home
Какова вероятность того, что он был сгенерирован 3G-абонентом?
>>P(A2/В)=  =
=  = 0,352
Задание 1. Демодуляция АМ-сигнала
Порядок выполнения работы:
1) Зададим временной массив t: 0≤t≤1;
2) Зададим линейные частоты модулирующего  и несущего
  колебаний.
3) Зададим амплитуду несущегосигнала  . Для модулирующего сигнала зададим амплитуду
  , постоянную составляющую
  , и начальную фазу колебаний
  .
.
4) Зададим коэффициент модуляции m: 0<m≤1 (при m>1 наступает перемодуляция(избыточная модуляция)), простые демодуляторы (типа квадратичного детектора) демодулируют такой сигнал с сильными искажениями.
5) Сгенерируем несущий сигнал и модулирующий сигнал, используя входные параметры:
 ;
;
 ;
;
6) Сгенерируем амплитудно-модулированный сигнал  :
:
 ;
;
Т.к. , то:
 ;
;
7) Сгенерируем массив случайных величин (соразмерный смассивом t),распределенных по равномерному закону в интервале (0, 1)[белый шум  ]. Зададим его амплитуду
  . В канале связи будет создаваться аддитивная помеха, т.е. сигнал на входе приемника будет иметь вид:
 ;
;
8) Проведем фильтрацию принимаемого сигнала .
Операция линейной дискретной фильтрации в общем случае описывается следующим образом:
 ;
;
 — отчёты входного сигнала;
 — отчёты выходного сигнала;
 —постоянные коэффициенты;
Максимальное из чисел  и
и  называется порядком фильтра.

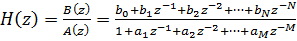
Рис 1. Цифровой рекурсивный фильтр
Передаточная функция фильтра имеет вид:
 ;
;
В среде MatLab используется функция  .
.
9) Зададим параметры фильтра:
 ;
;
 ;
;
И проведем операцию демодуляции принимаемого сигнала.
10) Вычислим отношение сигнал/шум по формуле:
 ;
;
Листинг программы
clear
t=0:0.001:1; %Задаем массив отсчетов времени
fc=100; %Задаем частоту несущего сигнала
fm=10; %Задаем частоту модулирующего сигнала
Uc0=3; %Задаем амплитуду несущего колебания
Um0=2; %Задаем амплитуду модулирующего сигнала
U0=3; %Задаем постоянную составляющую модулирующего сигнала
Un0=0.1; %Задаем амплитуду белого шума
fi0=pi/3; %Задаем начальную фазу модулирующего колебания
m=1; %Задаем коэффициент модуляции
Uc=Uc0*cos(2*pi*fc*t); %Задаем несущее гармоническое колебание
Um=U0+Um0*cos(2*pi*fm*t+fi0); %Задаем модулирующий гармонический сигнал
Uam=Uc0.*(1+m*Um/max(abs(Um))).*cos(2*pi*fc*t); %Выражение для АМ-сигнала
Un=Un0*randn(size(t)); %Генерирует белый шум с МО=0 и СКО=1
Ud=Uam+Un; %Сигнал на входе приемника (аддитивная помеха)
b=[1 1 1]; %Коэффиенты b цифрового фильтра
a=1; %Коэффициенты a цифрового фильтра
Udmd=filter(b,a,abs(Ud));
subplot(3,2,1)
plot(t,Um)
grid on
xlabel('Время, с')
ylabel('Амплитуда, B')
title ('Модулирующийсигнал')
subplot(3,2,2)
plot(t,Uc)
grid on
xlabel('Время, с')
ylabel('Амплитуда, B')
title ('Несущееколебание')
subplot(3,2,3)
plot(t,Uam)
grid on
xlabel('Время, с')
ylabel('Амплитуда, B')
title ('АМсигнал')
subplot(3,2,4)
plot(t,Un)
grid on
xlabel('Время, с')
ylabel('Амплитуда, B')
title ('Белыйшум')
subplot(3,2,5)
plot(t,Ud)
grid on
xlabel('Время, с')
ylabel('Амплитуда, B')
title ('Сигнал на входе приемника')
subplot(3,2,6)
plot(t,Udmd)
grid on
xlabel('Время, с')
ylabel('Амплитуда, B')
title ('Отфильтрованный сигнал')

Задание 2. Фильтрация сигналов для демодуляции амплитудно-манипулированных сигналов в гауссовских каналах связи.
Проделаем задание 2 аналогично заданию 1 с той лишь разницей, что в качестве модулирующего сигнала будет выступать битовая последовательность.
В задании использовался модифицированный код из предыдущего задания.

Рис 2. Временное представление модулирующей битовой последовательности, детектируемого сигнала и демодулированного сигналов 
 ;
;
Задание 3. Обнаружение детерминированного импульсного сигнала на фоне АБГШ.
Порядок выполнения работы:
1) Введём известные данные и посчитаем порог Байса для принятия решения  :
:
 ;
;
 ;
;
 ;
;
 ;
;
 ;
;
– гипотеза о том, что в сигнале  присутствует
  ;
;
 – гипотеза о том,в сигнале отсутствует ;
2) Из теории проверки статистических гипотез имеем:

Необходимо проверить соотношение:

Так как помеха, сгенерированная в задании 2, имеет математическое ожидание МО=0 и среднеквадратическое отклонение СКО=1, то:

Листинг программы
t=0:0.001:1; %Задаем массив отсчетов времени
fc=100; %Задаем частоту несущего сигнала
fm=10; %Задаем частоту модулирующего сигнала
Uc0=3; %Задаем амплитуду несущего колебания
Um0=2; %Задаем амплитуду модулирующего сигнала
U0=3; %Задаем постоянную составляющую модулирующего сигнала
fi0=pi/3; %Задаем начальную фазу модулирующего колебания
m=1; %Задаем коэффициент модуляции
Un0=0.3; %Задаем амплитуду белого шума
Uc=Uc0*cos(2*pi*fc*t); %Задаем несущее гармоническое колебание
Um=U0+Um0*cos(2*pi*fm*t+fi0); %Задаем модулирующий гармонический сигнал
Uam=Uc0.*(1+m*Um/max(abs(Um))).*cos(2*pi*fc*t); %Выражение для АМ-сигнала
Un=Un0*randn(size(t)); %Генерирует белый шум с МО=0 и СКО=1
Ud=Uam+Un; %Сигнал на входе приемника (аддитивная помеха)
U1=Un.^2;
U2=Um.^2;
U3=U1+U2;
U4=U3';
L=2.71828^(sum(U4));
disp('Отношение правдоподобий')
disp(L)

 , следовательно, на основании критерия Байса принимается гипотеза (в сигнале присутствует ).
Задача 4. Согласованная фильтрация сигнала.
Порядок выполнения работы:
1) Зададим вокне Workspace в среде MatLabпараметры, необходимые для решения задачи:
 ; Частота синусоидального радиосигнала;
 ; Время начала генерации импульсного сигнала;
 ; Длительность модулированного импульса;
 ;Масштабированный период радиосигнала (используется при умножении сигналов);
 ; Циклическая частота синусоидального сигнала;
 ; Полоса пропускания полосового фильтра;
2) В среде Simulinkсоставим блок-схему, реализующую согласованную фильтрацию сигнала:

Рис 3. Блок-схема согласованной фильтрации сигнала
Элементы блок-схемы

| 
|

| 
|
| Генерирует колебание 
|

| Перемножает входные сигналы;

|

Рис. 4. Сигналы 

| Блок передаточной характеристики  задает передаточную функцию в виде отношения полиномов: задает передаточную функцию в виде отношения полиномов:
|
 ,
,
где nnи nd ― порядок числителя и знаменателя передаточной функции;
num ― вектор или матрица коэффициентов числителя;
den ― вектор коэффициентов знаменателя;
 и
и  — преобразования Лапласа для сигналов
  (входной сигнал) и
  (выходной сигнал), причем:
 ;
;
 ;
;

| Сдвигает сигнал во времени на 
|

| Складывает сигналы, поступающие на входы «+», и вычитает сигналы, поступающие на входы «-» |

Рис. 5. Сигналы на экране осциллографа из Рис. 6.
Список использованной литературы
1. Краткая сводка по Matlab Н.Ю. Золотых
2. Статистические модели и методы обработки сигналов в системах радиосвязи: Учебное пособие / Ш.М.Чабдаров, Р.Р.Файзуллин, А.Ф.Надеев, Р.Х.Рахимов, А.Ю.Феоктистов; Казань: Изд-во Казан, гос. техн. ун-та. 1997. 90с.
3. Файзуллин Р.Р. Комплексный подход к решению задач синтеза и анализа эффективности алгоритмов и мультипроцессорных устройств обработки сигналов мобильных мультисервисных систем. Нелинейный мир, No2, т.9. М.: ЗАО ≪Издательство ≪Радиотехника≫, 2011. стр. 78 – 85.
4. Файзуллин Р.Р., Кадушкин В.В., Воробьев М.С. Полигауссовыйквазиоптимальный алгоритм многопользовательского разрешения сигналов. Нелинейный мир, No10, т.12. М.: ЗАО ≪Издательство ≪Радиотехника≫, 2014. стр. 27 – 31

