


1. —оздайте новый протокол. ƒл€ этого необходимо войти в меню У File Ф (действие 1), затем У New Ф (действие 2), затем нажмите левой кнопкой мышки  на У New protocol Ф (действие 3):

” ¬ас по€витс€ окошко с новым протокол, где будет отображена единственна€ гистограмма FS против SS.
2. ѕо умолчанию в приборах NaviosЩ и GalliosЩ активны все каналы флуоресценции. “ак как мы дл€ примера используем комбинацию из четырех флуорохромов (FL1 дл€ детекции флуоресценции FITC, FL2 Ц дл€ –≈, FL3 Ц дл€ ECD, FL4 Ц дл€ –—5), то нам необходимо отключить детекторы, которые не используютс€ дл€ проведени€ анализа (начина€ с FL5 и заканчива€ FL8).

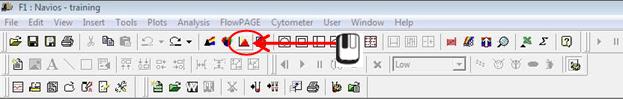
| ƒл€ этого необходимо зайти во вкладку УCytometerФ (действие 1) и выбрать нажатием левой кнопки мышки  УCytometer Controls..Ф (действие 2) УCytometer Controls..Ф (действие 2)
|
ѕосле этого у ¬ас по€витс€ окошко У Cytometer ControlФ вот такого вида:

„тобы отключить не используемые в рамках данного исследовани€ каналы флуоресценции, ¬ам необходимо нажатием левой кнопки мыши войти в раздел У Parameters Ф и убрать нажатием левой кнопки мышки  галочки напротив неиспользуемых каналов флуоресценции.

| 
|
| »сходный вид окна УParametersФ | ¬ид окна УParametersФ после отключени€ датчиков FL5-FL8 |
ѕосле проведени€ данной процедуры необходимо нажать  клавишу
  в нижнем левом углу данного окна. Ќажатие это клавиши сопровождаетс€ по€влением окошка:

¬ам необходимо сохранить изменени€ в протоколе, так как ¬ы внесли изменени€ в настройки каналов флуоресценции прибора. ≈сли ¬ы согласны с внесенными изменени€ми, то следует нажать У Yes Ф, если ¬ы допустили какие-либо ошибки или по каким-либо причинам не хотите сохран€ть внесенные изменени€, то следует нажать У No Ф. ¬ нашем случае все изменени€ настроек прибора были проведены правильно, следовательно, левой кнопкой мыши  нажимаем на клавишу У Yes Ф. ѕосле чего по€витс€ следующее окошко:

¬ам необходимо ввести название (подсвеченна€ синим строчка внизу окна Ц У File name Ф), под которым ¬аш протокол будет сохранен в папке У Acquisition Protocol Ф, например, пусть данный протокол будет называтьс€ У4color-setupФ. ¬водим это название в строчку У File name Ф и нажимаем  клавишу У Save Ф.

»так, ¬ы создали новый протокол под названием У4color-setupФ, в котором активны только первые четыре датчика дл€ регистрации флуорохромов FITC –≈, ECD и –—5.
3. “еперь ¬ам необходимо нарисовать гистограммы, которые будут отображать выбранные ¬ами параметры. ƒл€ настройки напр€жение при помощи изотипических контролей обычно используютс€ однопараметрические гистограммы.
—ледующий ¬аш шаг Ц это нарисовать гистограммы распредени€ флуоресценции по каналам FL1, FL2, FL3 и FL4.
ƒл€ этого в верхней части экрана ¬ам необходимо найти клавишу  и нажать на нее левой клавишей мыши
  .
.
Ќажатие данной клавиши приводит к тому, что у ¬ас по€вл€етс€ новое окошко с гистограммой (лева€ часть рисунка) и справа - панель под названием У Histogram Plot Properties Ф.
|
|
|
ѕо умолчанию данна€ гистограмма будет отображать по оси ’ пр€мое светорассе€ние. ƒл€ того, что изменить данную ось, ¬ам необходимо войти в графу У Parameter Ф, нажав левой кнопкой мыши по указанному на рисунке месту (действие 1), и выбрать из списка каналов FL1 дл€ детекции флуоресценции FITC (действие 2). » нажать клавишу  (действие 3).

»так, ¬ы построили первую гистограммы, где по оси УXФ отображаетс€ флуоресценци€ по каналу FL1, а по оси УYФ откладываютс€ событи€, обладающие данной флуоресценцией.
ќднако, нам необходимо создать аналогичные гистограммы еще и по FL2, FL3 и FL4.

| ƒл€ этого ¬ам необходимо активировать только что созданную гистограмму Ц нажав левой кнопкой мыши на ее верхнюю часть, после чего при помощи одновременного нажати€ клавиш УCtrlФ и УDФ ¬ы можете создать аналогичную гистограмму. ѕовтори это действие еще два раза.
ѕолучитс€ картинка, приведенна€ справа.
|
»так, ¬ы создали 4 гистограммы, где по оси УXФ отображаетс€ флуоресценци€ по каналу FL1, а по оси УYФ откладываютс€ событи€, обладающие данной флуоресценцией.
—ледующим шагом необходимо на второй гистограмме FL1 заменить на FL2, на третей Ц на FL3, на четвертой Ц на FL4.

| ƒл€ этого необходимо активировать третью сверху гистограмму нажатием левой кнопки мыши  на ее верхнюю часть (показано на рисунке). на ее верхнюю часть (показано на рисунке).
|

|
ѕосле чего ¬ам необходимо войти в УHistogram Plot PropertiesФ замены значений по оси ’.
ƒл€ этого нажатием правой кнопки мыши  на гистограмме вызовите диалоговое окно (действие 1), в котором нажатием левой кнопки мыши на гистограмме вызовите диалоговое окно (действие 1), в котором нажатием левой кнопки мыши  выберите раздел УFormat PlotФ (действие 2). выберите раздел УFormat PlotФ (действие 2).
|
ѕосле выбора раздела У Format Plot Ф у ¬ас по€витс€ окно У Histogram Plot Properties Ф.
¬ графе У Parameter Ф, нажав левой кнопкой мыши по указанному на рисунке месту (действие 1), и выберите из списка каналов FL2 дл€ детекции флуоресценции –≈ (действие 2). » нажать клавишу (действие 3).

јналогичную процедуру проделайте дл€ гистограммы 4 и 5, где следует заменить FL1 на FL3 и FL4, соответственно. ѕосле проведени€ этих действий у ¬ас рабочее пространство будет иметь следующий вид:

| ќбратите внимание на верхние части гистограмм Ц убедитесь, что ¬ы правильно провели замену осей (параметр, отображаемый на гистограмме, указан сверху и на рисунке отмечен красным овалом) |
—ледующее, что ¬ам необходимо сделать, это расставить гистограммы таким образом, чтобы они не налегали друг на друга. Ёто можно сделать следующим образом: навести курсор на верхнюю часть гистограммы (син€€ область сверху), кликнуть по ней левой кнопкой мыши , затем, удержива€ левую кнопку мыши в нажатом положении, переместить гистограмму в удобное дл€ ¬ас место на экране, после чего отжать левую кнопку мыши.
ќднако, если ¬ы хоти расположить гистограммы в правильном пор€дке и потер€ть гораздо меньше времени на эти манипул€ции, то следует сделать следующее:

| ќткрыть вкладку УWindowФ при помощи нажати€ левой кнопки мыши , после чего выбрать в открывшемс€ меню строку УTile SpecialФ и нажать на ней левую клавишу мыши .
|
ѕосле чего у ¬ас на экране по€витс€ окно У Tile Special Ф

| Ќекоторые обозначени€:
 - обозначает переход гистограмм на новый р€д, начина€ с гистограммы, напротив которые она стоит.
“аким образом, прибор предлагает на перейти на новый р€д с гистограммы с FL4, а все остальные гистограммы оставить верхнем р€ду.
„тобы выставить все гистограммы в одни р€д Ц левой кнопкой мыши кликните на , сто€щей напротив последней гистограммы с FL4, - обозначает переход гистограмм на новый р€д, начина€ с гистограммы, напротив которые она стоит.
“аким образом, прибор предлагает на перейти на новый р€д с гистограммы с FL4, а все остальные гистограммы оставить верхнем р€ду.
„тобы выставить все гистограммы в одни р€д Ц левой кнопкой мыши кликните на , сто€щей напротив последней гистограммы с FL4,
|

| исчезнет с экрана.
Ќажмите при помощи .
|
|
|
|
≈сли ¬ы все сделали правильно, то ¬аш экран приобретет следующий вид:

»так, ¬ы создали все необходимые гистограммы дл€ настройки прибора дл€ четырехцветного анализа.
—ледующим этапом €вл€етс€ построение регионов на гистограммах. ѕо правилам все негативные клетки должны располагатьс€ в первой декаде логарифмических шкал интенсивности флюоресценции по всем задействованным каналам. ¬ нашем случае Ц это каналы FL1, FL2, FL3 и FL4 Ц гистограммы 2, 3, 4 и 5, соответственно (слева направо на предыдущем рисунке).
ѕоэтому перед началом настройки прибора по изотипическим контрол€м необходимо нарисовать соответствующие регионы (от 100 до конца оси) на указанных гистограммах.
ƒл€ этого, необходимо сначала активировать интересующую нас гистограммы (предположим, гистограмму с FL1) нажатием левой кнопки мыши по верхней синей части.

| ѕосле чего выбрать, также левой кнопки мыши выбрать линейный регион под названием УSingle Linear RegionФ
|
ƒалее переведите мышку на активированную гистограммы (в нашем случае Ц FL1), при этом при по€влении в поле гистограммы курсов приобретает вид  , как это показано на рисунке

ƒалее, примерно выровн€йте курсор по 100 на оси FL1, после чего нажмите один раз на левую клавишу мыши . Ќа гистограмме по€витс€ следующа€ картина:

“ем самым, ¬ы установили начало нового региона на гистограмме. ≈сли ¬ы подвигаете вправо-влево, то увидите следующее (при движении мыши вправо):

“аким образом, ¬ы можете регулировать ширину ¬ашего региона (—ледует отметить, что место расположение горизонтальной перекладины по высоте не оказывает вли€ни€ на качество анализа, ее расположение должно завсеть от того, на какой высоте ¬ам в дальнейшем будем максимально удобно видеть процент чстиц, попадающих в выбранный ¬ами диапозон!!!)
ак только ¬ы определились с местом установки верхней границы региона (конец оси координат), нажмите левую клавишу мыши . –егион установлен, и ему автоматически будет присвоено название Ц в нашем случае У B Ф.
ѕовторите данную процедуру дл€ гистограмм по FL2, FL3 и FL4, нарисуйте на них аналогичные регионы.

¬ итоге у ¬ас должна получитьс€ следующа€ картина (на всех однопараметрических гистограммах находит по одному линейному региону, которые начинаютс€ около 100 и заканчиваютс€ в конце оси УXФ):
“еперь вернемс€ к гистограмме FS против SS.
ѕо умолчанию, на данной гистограмме регион У A Ф обладает свойства УавтогейтаФ. „то это обозначает? „ерез 10 секунд после начала анализа образца данные регион автоматически перенесетс€ на ближайшую попул€цию. ¬ услови€х настройки напр€жени€ по пр€мому и боковому светорассе€нию эта опци€ €вл€етс€ излишней, так как посто€нное изменение параметров напр€жени€ будет сопровождатьс€ посто€нными перестройками данного гейт. ѕоэтому на стадии настройки рекомендуетс€ эту опцию отключать.
ак это сделать?
ƒл€ этого необходимо войти в свойства региона:
јктивизируйте гистограмму при помощи нажати€ левой кнопкой мыши по верхнему синему полю гистограммы. ƒале наведите курсор на регион У ј Ф, таким образом, что бы курсор мыши имел вид  , и нажмите левую кнопку мыши

ак только регион активировалс€ (по€вились квадраты по углам), не сдвига€ мышки из этого положени€, нажимайте правую кнопку мыши и, в по€вившемс€ окне, выбирайте графу У Region Properties Ф и нажимайте на левую кнопку мышки .

¬ разделе У Autogating Ф необходимо переставить точку из позиции У Eliptical Фв позицию У None Ф Ц дл€ этого просто клините левой клавишей мыши на пустом окошке напротив позиции У None Ф, после чего нажмите .
|
|
|

| 
|
| ”становки Ђпо умолчаниюї дл€ региона Ђјї | ѕосле проведени€ описанной выше операции |
¬ дальнейшем, в указанную область мы поместим попул€цию лимфоцитов Ц целевую попул€цию клеток, дл€ анализа уровн€ экспрессии антигенов которой и происходит настройка прибора. »менно поэтому следующим шагом необходимо сделать так, чтобы на гистограммах, при помощи которых будет осуществл€тьс€ оценка уровн€ экспрессии данных антигенов, отображались только клетки, соответствующие по размеру и структуре лимфоцитам. ƒанна€ процедура получила название Ђгейтированиеї, то есть введение данных логических ограничений из одной гистограммы в другие. ƒанна€ функци€ позвол€ет отображать и анализировать событи€, попадающие исключительно интересующие нас область. »так, интересующие нас событи€ в дальнейшем будут попадать в область УAФ. „тобы только эти событи€ отображались на остальных гистограммах (однопараметрические гистограммы по FL1, FL2, FL3 иFL4) надо сделать следующее.
Ќа интересующей нас гистограмме (дл€ примера Ц гистограмма FL1), необходимо войти в У Histogram Plot Properties Ф, как это мы делали ранее. ¬кратце, нажатием правой кнопки мыши на гистограмме вызовите диалоговое окно, в котором нажатием левой кнопки мыши выберите раздел У Format Plot Ф.

| ƒалее левой кнопкой мышки необходимо нажать на раздел УGateФ, как это показано на рисунке (действий 1)
и
Ќажатием левой клавиши мыши выбрать интересующий ¬ас регион из предложенного списка (в данном случае Ц регион УAФ (действие 2(
|
ѕосле нажати€ клавиши операци€ будет завершена.

| ƒл€ проверки правильности проведени€ это процедуры ¬ы можете обратитьс€ к верхней части гистограммы (помечено на рисунке). Ќазвание региона, по которому Ђзагейтированаї данна€ гистограмма, находитс€ в квадратных скобках Ц в нашем случае это регион УAФ. |
ƒанную последовательность действий необходимо повторить дл€ гистограмм, отображающих флуоресценцию по FL2, FL3 и FL4.
–аз мы остановились на опци€х окошка У Histogram Plot Properties Ф, то давайте сразу сделаем еще р€д действий.
1. ¬ созданном протоколе отсутствуют услови€ дл€ остановки сбора данных, следовательно, прибор будет набирать событи€ до ограничений, установленных Ђпо умолчаниюї (дл€ приборов NaviosЩ и GalliosЩ это 100 000 событий и 300 секунд Ц это можно посмотреть в окошке У Cytometer Control Ф), причем сюда вход€т не только событи€ Ђинтересаї, но также и все то, что прибору позвол€ют анализировать установленные настройки. ¬ случае проведени€ собственных исследований нас, в первую очередь, интересуют наши определенные клетки Ц например, лимфоциты периферической крови в приводимом здесь примере. Ћимфоциты (после проведени€ предварительных настроек по параметрам пр€мого и бокового светорассе€ни€) будут находитьс€ в регионе УAФ. —ледовательно, необходимо установить ограничение именно по этому типу клеток. √де его устанавливать? Ќа любой гистограмме, где отображаютс€ событи€, попадающие в регион УAФ Ц в нашем случае это люба€ из однопараметрических гистограмм по FL1, FL2, FL3 или FL4, в окошке У Histogram Plot Properties Ф необходимо перейти во вкладку У Stop and Save Ф при помощи нажати€ левой кнопкой мышки (действие 1), после чего необходимо активировать строку У Use Stop Condition Ф нажатием левой кнопкой мышки (действие 2).

ѕосле чего поставьте курсор мыши на данную строку и, кликнув левой клавишей мыши , при помощи клавиатуры введите в строку У Maximum Events Ф необходимое число событий, которое хотите собрать по данной гистограмме (дл€ примера Ц 5000).
|
|
|
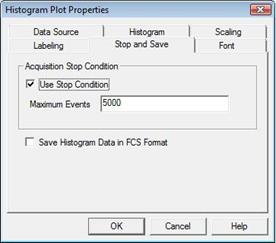
Е и нажмите .
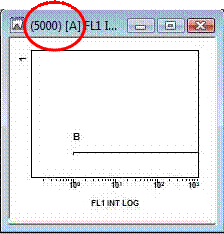
| ƒл€ проверки правильности проведени€ это процедуры ¬ы можете обратитьс€ к верхней части гистограммы (помечено на рисунке). ѕеред названием, региона, по которому Ђзагейтированаї данна€ гистограмма, в круглых скобках Ц в нашем случае (5000) - по€витс€ число событий, после набора которых прибор автоматически остановит сбор данных и сохранит полученный результат в папку УLMDФ. |
2. ƒл€ корректного выставлени€ напр€жени€ по изотипическим контрол€м необходимо видеть, сколько клеток выходит за пределы первой декады логарифмической шкалы флуоресценции (см. ниже). —ледовательно, на гистограммах должно отображатьс€ число событий, попадающих в область УBФ на первой гистограмме, а также остальные области на соответствующих гистограммах.
ƒл€ этого необходимо снова зайти в У Histogram Plot Properties Ф, вкладка У Data Source Ф и при помощи левой клавишей мыши поставить галочки в пустых окошках напротив У Show % on plot Ф (после этого р€дом с названием области по€витс€ знак У 0,0% Ф) и У Apply % on plot to all plot Ф (в этом случае значки У 0,0% Ф по€в€тс€ около названий всех регионов, нарисованных в данном протоколе).
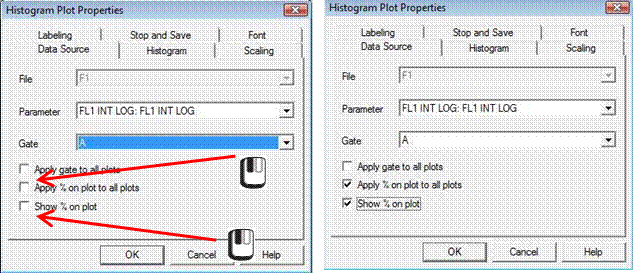
ƒл€ проверки правильности проведени€ это процедуры ¬ы можете обратитьс€ гистограммам Ц около названи€ регионов на всех гистограммах по€вились знаки У 0,0% Ф (на рисунке обведено красными кругами)

ѕо завершении всех действий все изменени€ в проколе необходимо сохранить.
ƒл€ этого левой клавишей мыши следует нажать на клавишу  У Save Protocol Ф в левой верхней части экрана.


