(обязательное)
//Plot phase mismatch
void MainWindow::calc_phase()
{
setGraphData();
const int n = 2000;
double *n0r = new double [n];
double *n1r = new double [n];
double *n0l = new double [n];
double *n1l = new double [n];
double *N0r = new double [n];
double *N1r = new double [n];
double *N0l = new double [n];
double *N1l = new double [n];
double *k0r = new double [n];
double *k1r = new double [n];
double *k0l = new double [n];
double *k1l = new double [n];
double *Kr = new double [n];
double *Kl = new double [n];
for (int i=0; i<n; ++i)
{
Q[i]=1.571-Q[i];
n0r[i]=(ne*no)/sqrt((no*no)*(sin(Q[i]+teta)*sin(Q[i]+teta))+(ne*ne)*(cos(Q[i]+teta)*cos(Q[i]+teta)));
n1r[i]=(ne*no)/sqrt((no*no)*(sin(Q[i]-teta)*sin(Q[i]-teta))+(ne*ne)*(cos(Q[i]-teta)*cos(Q[i]-teta)));
n0l[i]=(ne*no)/sqrt((no*no)*(sin(3.14-Q[i]+teta)*sin(3.14-Q[i]+teta))+(ne*ne)*(cos(3.14-Q[i]+teta)*cos(3.14-Q[i]+teta)));
n1l[i]=(ne*no)/sqrt((no*no)*(sin(3.14-Q[i]-teta)*sin(3.14-Q[i]-teta))+(ne*ne)*(cos(3.14-Q[i]-teta)*cos(3.14-Q[i]-teta)));
N0r[i]=asin((n0r[0]/n0r[i])*sin(teta));
N1r[i]=asin((n1r[0]/n1r[i])*sin(teta));
N0l[i]=asin((n0l[0]/n0l[i])*sin(teta));
N1l[i]=asin((n1l[0]/n1l[i])*sin(teta));
k0r[i]=2*(3.14/lambda)*n0r[i]*cos(N0r[i]);
k1r[i]=2*(3.14/lambda)*n1r[i]*cos(N1r[i]);
k0l[i]=2*(3.14/lambda)*n0l[i]*cos(N0l[i]);
k1l[i]=2*(3.14/lambda)*n1l[i]*cos(N1l[i]);
Kr[i]=k0r[i]-k1r[i];
Kl[i]=k0l[i]-k1l[i];
}
for (int i=0; i<n; ++i)
{
Qr[i]=0;
Ql[i]=0;
for (int j=0; j<=i; ++j)
{
Qr[i]=Qr[i]+Kr[j];
Ql[i]=Ql[i]+Kl[j];
}
}
for (int i=0; i<n;++i)
{
Qr[i]=Qr[i]*(d/n);
Ql[i]=Ql[i]*(d/n);
}
delete n0r;
delete n1r;
delete n0l;
delete n1l;
delete N0r;
delete N1r;
delete N0l;
delete N1l;
delete k0r;
delete k1r;
delete k0l;
delete k1l;
delete Kr;
delete Kl;
}
void MainWindow::plot_phase()
{
graph = 2;
const int n = 2000;
double *y1 = new double [n];
ui->qwtPlot->setAxisScale(QwtPlot::xBottom, (-d/2)*1000000, (d/2)*1000000);
ui->qwtPlot->setAxisScale(QwtPlot::yLeft, -4, 4);
for (int i=0; i<n;++i)
y1[i]=(-d/2+i*(d/n))*1000000;
//ui->doubleSpinBox->setValue(fabs(n1r[1000]));
//curve1->attach(ui->qwtPlot);
ui->x_label->setText("d, um");
ui->y_label->setText("Phase mismatch, abs. units");
zoomer = new ScrollZoomer(ui->qwtPlot->canvas());
curve->setSamples(y1,Ql,n);
curve1->setSamples(y1,Qr,n);
curve->attach(ui->qwtPlot);
curve1->attach(ui->qwtPlot);
curve2->detach();
ui->qwtPlot->replot();
deletey1;
}
Приложение Г. Листинг функций расчета дифракционных характеристик
(обязательное)
//Plot diffraction characteristics
void MainWindow::plot_dif()
{
QFile file("data.csv");
graph = 3;
setGraphData();
calc_phase();
const int n = 2000;
double *delta = new double [n];
ui->qwtPlot->setAxisScale(QwtPlot::xBottom, -20, 20);
ui->qwtPlot->setAxisScale(QwtPlot::yLeft, 0, 1);
std::complex<double> *cIdr = new std::complex<double> [n];
std::complex<double> *cIdl = new std::complex<double> [n];
std::complex<double> *cIds = new std::complex<double> [n];
std::complex<double> temp;
double *Idr = new double [n];
double *Idl = new double [n];
double *Ids = new double [n];
double *y1 = new double [n];
for (int i=0; i<n;++i)
y1[i]=(0+i*(d/(n-1)));
for (int i=0; i<n;++i)
{
delta[i]=(-20+i*(2*20)/(n-1));
}
for (int i=0; i<n; ++i)
{
cIdr[i]=std::complex<double> (0,0);
cIdl[i]=std::complex<double> (0,0);
cIds[i]=std::complex<double> (0,0);
for (int j=0; j<n; ++j)
{
temp=std::complex<double> (0,delta[i]*(y1[j]/d)+Qr[j]);
cIdr[i]=cIdr[i]+(1.0)*exp(temp);
temp=std::complex<double> (0,delta[i]*(y1[j]/d)+Ql[j]);
cIdl[i]=cIdl[i]+(1.0)*exp(temp);
cIds[i]=(cIdr[i]+cIdl[i])/2.0;
}
}
for (int i=0; i<n; ++i)
{
Idr[i]=pow(abs(cIdr[i])/n,2);
Idl[i]=pow(abs(cIdl[i])/n,2);
Ids[i]=pow(abs(cIds[i])/n,2);
}
//Recording data to file
//***************
QTextStream out(&file);
if(file.open(QIODevice::WriteOnly|QIODevice::Truncate))
{
out<<"Diff. eff. positive"<<';';
out<<"Diff. eff. negative"<<';';
out<<"Diff. eff. summary"<<';';
out<<"Relative mismatch"<<';'<<"\r\n";
for (int i=0; i<n; ++i)
{
out.setRealNumberNotation(QTextStream::ScientificNotation);
out<<Idr[i]<<';';
out<<Idl[i]<<';';
out<<Ids[i]<<';';
out<<delta[i]<<';'<<"\r\n";
}
file.close();
}
//***************
ui->x_label->setText("delta, abs. units");
ui->y_label->setText("Diffraction efficiency, abs. units");
zoomer = new ScrollZoomer(ui->qwtPlot->canvas());
curve->setSamples(delta,Idl,n);
curve1->setSamples(delta,Idr,n);
curve2->setSamples(delta,Ids,n);
curve->attach(ui->qwtPlot);
curve1->attach(ui->qwtPlot);
curve2->attach(ui->qwtPlot);
ui->qwtPlot->replot();
delete delta;
delete Idr;
delete Idl;
delete y1;
delete cIdr;
delete cIdl;
}
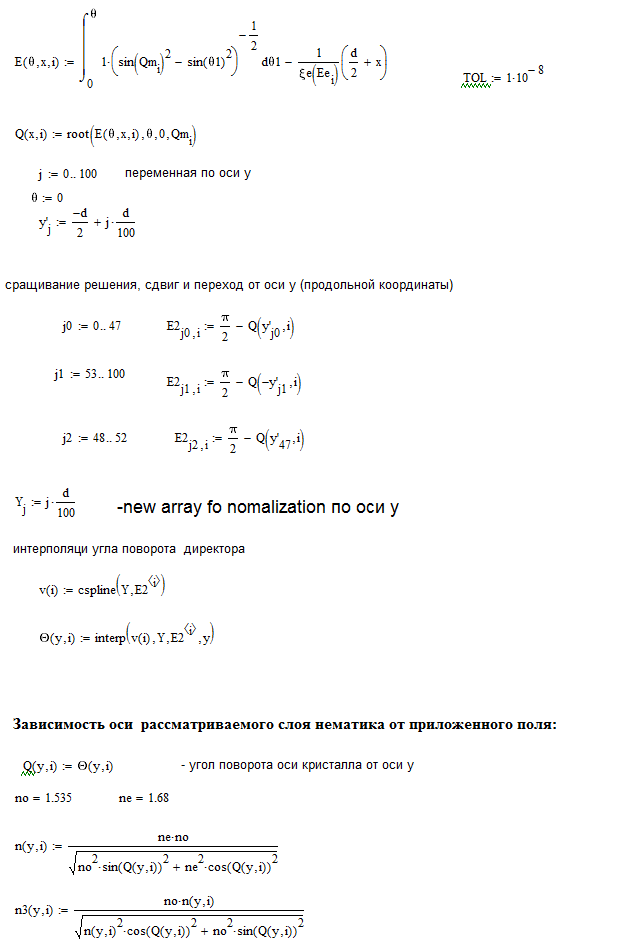
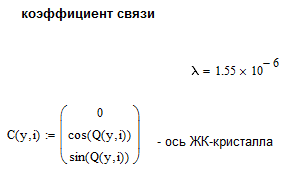
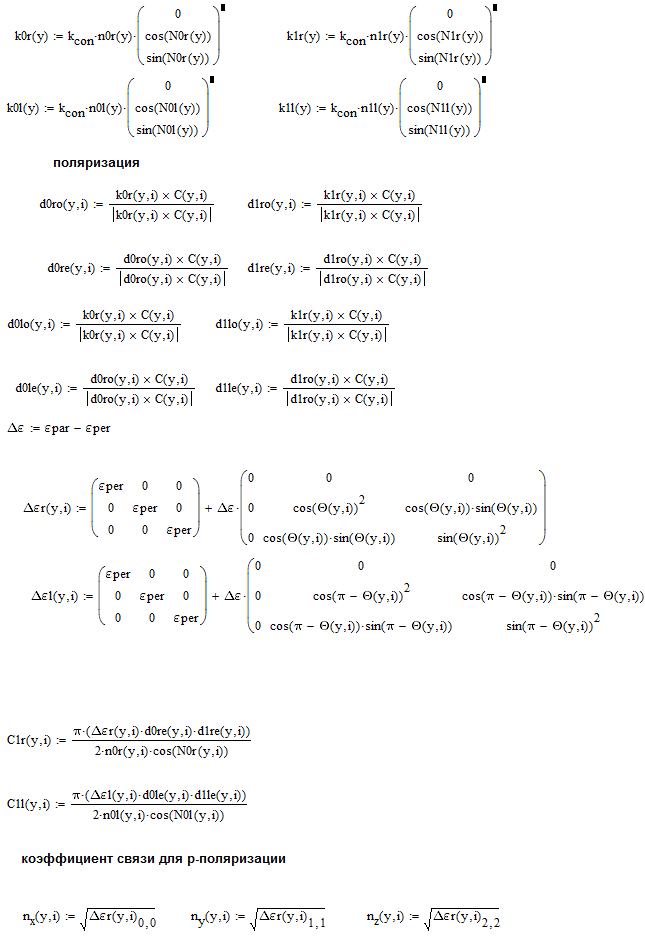
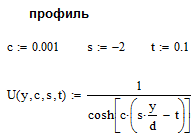
Приложение Д. Листинг программы в MathCAD
(обязательное)


|
| подставляем |

|

|

|

|
| волна с учетом ампл. коэф. и фазы |

|

|


