


Найти векторное произведение векторов  и
и  . Изобразить все данные и результат. Первый вектор изобразить синим, второй зеленым, результат красным. Сделать выводы: как связаны определение векторного произведения и то, что мы получили на рисунке.
%Задаем векторы
a=[1,2,0];b=[2,1,0];
% Находим векторное произведение
c=cross(a,b)
% Нашли векторное произведение.
% Это будет вектор с координатами c =(0,0,-3)
% офоррмляем график, задаем коорд оси
grid on, hold on, axis square
line([-5 0 0;5 0 0], [0 -5 0;0 5 0],[0 0 -5;0 0 5],'Color','black')
% первый вектор, по умолчанию цвет - синий
line([0 1],[0,2],'LineWidth',4)
% конец вектора, по умолчанию цвет синий
plot3(1,2,0,'>','LineWidth',4)
% второй вектор
line([0 2],[0,1],'Color','green','LineWidth',4).
plot3(2,1,0,'>g','LineWidth',4)
% результат векторного произведения c =(0,0,-3)
line([0 0],[0,0],[0 -3],'Color','red','LineWidth',4)
plot3(0,0,-3,'>r','LineWidth',4) % конец вектора
plot3(5,0,0,'<k','LineWidth',2) % направление оси 0X
plot3(0,5,0,'>k','LineWidth',2) %направление оси 0Y
plot3(0,0,5,'^k','LineWidth',2) % направление оси 0Z
text(5,-0.5,0.8,'X') % подпись оси 0X
text(-0.5,5,0.8,'Y') % подпись оси 0X
text(-0.5,-1,5,'Z') % подпись оси 0Z
Как только появится графическое окно “Figure 1”, с помощью круговой стрелочки “Rotate3D” (cм. панель инструментов), разворачиваем плоскую картинку в объемную и разворачиваем изображение.

Рис. 1
Выводы: Синий вектор  , зеленый вектор
  и красный вектор
  образуют правую тройку. Вектор
  перпендикулярен плоскости векторов
  и
и  .
.
Изобразим параллелограмм, натянутый на векторы  и
и  .
.
Найдем длину вектора  -длина вектора равна площади параллелограмма сторонами которого являются векторы и .
Изобразим плоскость параллелограмма:

Рис. 2.
% соединим штриховкой зеленый вектор – сторону параллелограмма
% и параллельную ей сторону параллелограмма
%каждый отрезок имеет начало в точке (x1, y1), конец в точке (x2,y2)
% смотрим на зеленый вектор-отрезок, задаем диапазон изменения
% начальных координат абсцисс x1
x1=0.1:0.1:1.9;
% y1 связан с x1 прямой y=x/2, поэтому
y1=x1/2;
% координаты (x2,y2) поучаются сдвигом (x1,y1) на вектор a
% (x2,y2)=(x1,y1)+a=(x1+1,y1+2)
% операция x1+1 осуществит прибавление единицы
% к каждому элементу массива x1
x2=x1+1; y2=y1+2;
line([x1; x2],[y1; y2],'LineWidth',4, 'Color',[0.8 0.1 0.7])
Получаем
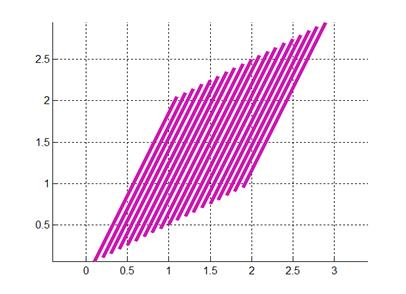
Рис. 3.
Соеденив два куска программы получим:

Рис. 4
Чтобы изобразить плоскость параллелограмма, можно также воспользоваться встроенной функцией fill(). Ознакомьтесь с форматом входных аргументов в документации.
>> fill([0 2 3 1], [0 1 3 2], 'm')

Рис. 5
Упражнение 4. Вычислить площадь треугольника с помощью векторного произведения. Изобразить*** геометрический смысл.
Вычислить площадь треугольника с вершинами 
 и
и  Изобразить плоскость треугольника. Как соотносятся (алгебраически и геометрически) площадь треугольника и векторное произведение. Изобразить геометрический смысл задачи по аналогии с предыдущим упражнением.
Упражнение 5. Изучить понятие смешанного произведения. Задать три некомпланарных вектора. Свести их к общему началу. Построить на этих векторах параллелепипед и тетраэдр. Найти объем данных фигур, используя понятие смешанного произведения. Вывести формулу, связывающие эти объемы.
Отметим, что векторное произведение векторов и смешанное произведение векторов (которого мы здесь не касались) наряду со скалярным произведением используется не только для вычисления площадей и объёмов, но является одним из основных инструментов для исследования прямых и плоскостей в пространстве (задач на составление уравнений прямых и плоскостей, взаимное расположение прямых и плоскостей и т.д.).
3. Контрольные вопросы.
Рассмотрим определиитель

Заменим 1-й столбец произвольными числами h 1, h 2, h 3:
 .
.
Обосновать, доказать: почему, если вместо чисел h 1, h 2, h 3 взять элементы 2-го или 3-го столбцов определителя, получим нули
 ,
,  ?
?
Может ли определитель 3-го порядка не быть числом?
Изменится ли определитель 3-го порядка, если в нем строки заменить столбцами и наоборот (проверьте!)?
Изменится ли определитель 3-го порядка, если в нем строки (или столбцы) поменять местами (проверьте!)?
Изменится ли определитель 3-го порядка, если в нем из одной строки вычесть другую строку (проверьте!)?
Изменится ли определитель 3-го порядка, если в нем из одного столбца вычесть другой столбец (проверьте!)?
Изменится ли определитель 3-го порядка, если в нем строку умножить на число 2 (проверьте!)?
Существует ли определитель для матрицы:  ?
?
1. Векторное произведение двух векторов и его свойства.
2. Смешанное произведение трех векторов и его свойства.
3. Определение расстояния между векторами.

