


ѕостроение графиков функций одной переменной
»нструментальна€ панель графических окон
ѕостроение трехмерных изображений
ѕостроение графиков функций одной переменной
—истемаMatLabможет создавать как плоские графики, так и трехмерные сетчатые поверхности, а также движущиес€ графики, или анимацию.
¬ научных и технических задачах основными и наиболее часто употребительными €вл€ютс€ графики, которые представл€ют собой кривые, описывающие те или иные численные данные. MatLabрасполагает набором команд высокого уровн€, которые используютс€ дл€ построени€ таких кривых и управлени€ ими. Ёто такие команды, как plot, title, axis, text, hist, contour и р€д других. роме того, строить графики, управл€ть ими и редактировать их можно с помощью инструментальных панелей графических окон. ћожно также использовать комбинацию обоих подходов. Ќапример, можно использовать команды дл€ создани€ графиков, а затем модифицировать их.
ƒл€ того чтобы построить график функции y=f(x), достаточно тем или иным способом сформировать два вектора одинаковой размерности - век≠тор значений аргументов x и вектор соответствующих значений функции у, а затем выполнить команду plot. оманда plot открывает графическое окно и отображает в нем зависимость y(x) в линейных ос€х, при условии что x и y €вл€ютс€ векторами одинаковой длины.
–ассмотрим пример построени€ графика синуса на интервале от -4 до 4.
| >>x = -4:.01:4; >>y = sin(x); >>plot(x,y); >> |
¬ результате выполнени€ команд открываетс€ графическое окно (рис. 3.2-1).
¬ вышеописанном примере вектор x €вл€етс€ набором равноотсто€щих точек с шагом 0.01, а y - вектор со значени€ми функции синуса в этих точках. ƒл€ отображени€ графика системаMatLab открывает отдельное окно с именем Figure 1. ѕереход между окнами, то есть возврат в окно MatLabили переход от одного графического окна к другому графическому окну осуществл€етс€ в соответствии с правилами среды: с помощью команд основного меню; комбинации < Alt+Tab>или с помощью мыши.

–ис. 3.2-1. √рафическое окно с графиком функции y=sin(x)
¬ вышеописанном примере вектор x €вл€етс€ набором равноотсто€щих точек с шагом 0.01, а y - вектор со значени€ми функции синуса в этих точках. ƒл€ отображени€ графика системаMatLab открывает отдельное окно с именем Figure 1. ѕереход между окнами, то есть возврат в окно MatLab или переход от одного графического окна к другому графическому окну осуществл€етс€ в соответствии с правилами среды: с помощью команд основного меню; комбинации < Alt+Tab>или с помощью мыши.
–ассмотрим еще один пример п остроени€ графика y=e−x2на интервале
[-1.5;1.5].
| >> x = - 1.5:.01:1.5; >> y = exp(-x.ˆ2); >> plot(x,y) >> |

–ис. 3.2-2. √рафик функции y=e−x2
Ќеобходимо обратить внимание на то, что точка перед знаком возведени€ в степень (^)об€зательна, поскольку мы хотим, чтобы возведение в степень выполн€лось поэлементно.
|
|
|
¬ системеMatLab можно также построить кривые, заданные параметрически.
| >> t=0:.001:2*pi; >> x=cos(3*t); >> y=sin(2*t); >> plot(x,y) >> |

–ис. 3.2-3. √рафик функции, заданный параметрически
јргументами функции plot() могут быть различные комбинации векторов и матриц:
Ј plot(y):
Ј если y - вектор, то будет нарисована крива€ y как функци€ номера элемента в y;
Ј если y - матрица, то будет сгенерирован набор кривых, кажда€ из которых представл€ет собой зависимость столбца матрицы от номера строки.
Ј plot(x,y)
Ј если x и y - вектора одинаковой длины и размерности (оба строки или оба столбцы), то будет нарисована крива€ y от x;
Ј если x - вектор, а y - матрица, строки или столбцы y будут нарисованы в зависимости от x; если столбец матрицы y имеет ту же длину, что и вектор x, то будет построен набор кривых, представл€ющий зависимость каждого из столбцов от x; если строка матрицы y имеет ту же длину, что и вектор x, то будет построен набор кривых, представл€ющий зависимость каждой из строк от x; если число строк и столбцов y одинаково, то стро€тс€ столбцы от x;
Ј если x -матрица, а y -вектор, то будет построено несколько кривых, представл€ющих зависимость y от строк или столбцов матрицы x по правилу, описанному в предыдущем пункте;
Ј если x и y -матрицы одинаковой размерности, то будет построен набор кривых, представл€ющих столбцы y от столбцов x.
ѕри вышеописанных способах вызова функции plot() различные кривые на одном и том же графике рисуютс€ разным цветом. ѕеребор цветов выполн€етс€ автоматически, а при использовании соответствующих аргументов у команды plot() эти цвета можно выбирать.
¬ общем случае, число аргументов у команды plot() не ограничиваетс€ двум€, то есть plot(x1,y1,x2,y2,...), причем правила, описанные выше, относ€тс€ к каждой паре аргументов.
— помощью соответствующих команд любой график в графическом окне MatLab может быть снабжен заголовком, именами осей, и на сам график может быть помещен дополнительный текст с помощью команд вывода текста. Ќа график можно так же поместить сетку. јргументами всех этих команд €вл€етс€ текстова€ строка. Ќапример, команда title('√рафик наилучшего приближени€') добавит к вашему графику заголовок. оманда gtext('ѕ€тно') позвол€ет с помощью мыши или клавишного курсора разместить на рисунке индикаторный крест, в месте размещени€ которого и будет помещен текст после нажати€ произвольной клавиши. ѕри необходимости сделать подписи осей используютс€ команды Xlabel('ѕодписьX'), Ylabel('ѕодписьY').
ƒл€ изображени€ нескольких кривых на одном рисунке существуют два способа, которые иллюстрируютс€ следующими примерами.
| >> x=0:.01:2*pi; >> y1=sin(x); >> y2=sin(2*x); >> y3=sin(4*x); >> plot(x,y1,x,y2,x,y3) >> |
| >> x=0:.01:2*pi; >> Y=[sin(x)Т, sin(2*x)Т, sin(4*x)Т]; >> plot(x,Y) >> |
Ёти два примера полностью эквивалентны, а результат изображен на рис. 3.2-4. ќтметим, что во втором примере формируетс€ матрица Y, содержаща€ значени€ изображаемых функций в виде столбцов.

–ис 3.2-4. √рафикифункций y1=sin(x); y2=sin(2*x);y3=sin(4*x);
ƒругим способом такого отображени€ нескольких функции на одних ос€х €вл€етс€ использование команды holdon, котора€ замораживает текущий график, так что последующие кривые размещаютс€ на этом же графике. ѕри этом масштаб и разметка осей измен€ютс€, если нова€ крива€ не вписываетс€ в нарисованные оси. оманда holdoff приводит к тому, что любой последующий вызов команды plot создает новый рисунок в этом же окне, то есть предыдущий график стираетс€.
|
|
|
ѕри выводе графика можно сменить прин€тый по умолчанию тип точек, с помощью которых рисуетс€ данный график.
| >> x=0:.01:2*pi; >> y1=sin(x); >> y2=sin(2*x); >> y3=sin(4*x); >> plot(x,y1,Т--Т,x,y2,Т:Т,x,y3,Т+Т) >> |
–езультат работы программы приведет к тому, что первый график будет нарисован пунктиром, второй - точками, а третий - символами + (рис. 3.2-12). ¬ общем случае кажда€ лини€ на графике определ€етс€ триплетом x,y,s, где x и y - это вектора с координатами функции, а s Ц строкова€ переменна€, образованна€ любыми комбинаци€ми из каких-нибудь приведенных ниже столбцов таблицы 3.2-5.

–ис. 3.2-5. ѕример графика Sin(x), Sin(2x) и Sin(3x)
. “аблица 3. 2-1
| S | ÷вет | S | ћаркер |
| y | желтый | . | точка |
| m | фиолетовыйo | кружок | : |
| c | голубой | x | x-метка |
| r | красный | + | плюс |
| g | зеленый | * | звездочка |
| b | синий | s | квадрат |
| w | белый | d | алмаз |
| k | черный | v | “реугольник(вниз) |
| И | треугольник (вверх) | - | сплошна€ |
| < | треугольник (влево) | точечна€ | |
| > | треугольник (вправо) | -. | Ўтрих - пунктирна€ |
| p | шестиугольник | - | пунктирна€ |
| h | восьмиугольник |
ѕо умолчанию масштаб осей выбираетс€ автоматически, таким образом, чтобы график целиком поместилс€ в окне, причем с разумным запасом. роме того, оси автоматически размечаютс€, и по умолчанию выбираетс€, декартова система координат. ѕричем началом координат считаетс€ точка с координатами xmin, ymin, расположенна€ в левом нижнем углу. Ёта автоматическа€ установка может быть изменена с помощью команды axis. ѕримеры использовани€ этой команды применительно к плоским графикам описаны в табл. 2.5-9.
ѕри необходимости вывести в одном графическом окне несколько графиков, то есть разбить графическое окно на несколько областей - подобластей, в каждой из которых отображаютс€ свои оси, используетс€ команда subplot(m,n,p). «начение m указывает, на сколько областей окно разбиваетс€ по вертикали, n Ц по горизонтали, а p -пор€дковый номер подокна при счете слева направо и сверху вниз. оманда subplot используетс€ как дл€ создани€ нового подокна, так и дл€ перехода от одного подокна к другому. ѕосле вызова этой команды plot построит график или графики в соответствующем подокне. Ќапример, последовательность команд ѕримера 3.2-6 строит два рисунка в верхней и нижней части экрана. ¬ верхней части строитс€ график sin(x), а в нижней части экрана - зависимость log(abs(sin(x))). ак видно из приведенной выше последовательности команд, при x=0 вычисл€етс€ log(0). ѕри этом в командном окне по€вл€етс€ предупреждение, а график строитс€ в точках −1 ≤ x ≤ 0.1 и 0.1 ≤ x ≤ 1.
“аблица 3 .2 -2
| ќбращение | –езультат |
| axis([xminxmaxyminymax]) | ”станавливает пределы изменени€ по xи yкоординатам соответственно. ≈сли максимальный предел по любой координате установить равным Inf, то соответствующий предел будет определ€тьс€ автоматически. јналогичное справедливо дл€ нижнего предела, если его установить равным -Inf. |
| axis(ТsquareТ) | ƒелает область вывода квадратной. |
| axis(ТequalТ) | ƒелает единицы измерени€ по оси xи yодинаковыми. |
| axis(ТnormalТ) | ¬осстанавливает режим по умолчанию. |
| axis(ТijТ) | ѕомещает начало координат в левый верхний угол. Ќаправление оси x- слева направо, направление оси y- сверху вниз. |
| axis(ТxyТ) | ¬осстанавливает стандартную декартову систему координат с началом в левом нижнем углу и направлением оси yснизу вверх. |
| axis(ТtightТ) | ”станавливает пределы по ос€м точно равными максимальным и минимальным значени€м соответствующих переменных. |
| axis(ТoffТ) | ƒелает невидимыми оси, метки осей и надписи |
| axis(ТonТ) | ¬ключает оси и их разметку. |
|
|
|
| >> x= -1:.1:1; >> y1=sin(x); >> subplot(2, 1, 1), plot(x, y1); >> y2=log(abs(y1)); >> subplot(2, 1, 2), plot(x,y2); >> |
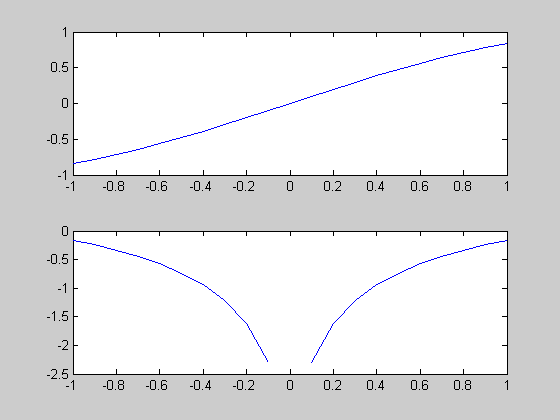
–ис.3.2-6. ƒве подобласти в одном графическом окне
ѕол€рными координатами(ρ,θ)точки P (рис. 3.2-7) называютс€ длина ρ ра≠диус - вектора, проведенного из начала координат в точку P, и угол θ, образо≠ванный между осью х и этим вектором. ”гол отсчитываетс€ от положитель≠ного направлени€ оси х к радиус-вектору против часовой стрелки.
ƒовольно многие математические кривые с целью устранени€ неоднознач≠ности прин€то задавать в пол€рной системе координат.
ƒл€ построени€ графиков функций, заданных в пол€рной системе коорди≠нат, вместо функции plot используетс€ функци€ polar:
| >> phi=0:0.1:2*pi; >>ro=5*(i+cos(phi)); >> polar(phi,ro); >> title {' ардиоида'); >> | ||
–езультат построени€ кардиоиды дл€ а=5 приведен на рис. 3.2-7.
–ис.3.2-7.√рафик кардиоиды в пол€рной системе координат
≈диницы измерени€ значений ординат и абсцисс далеко не всегда соответ≠ствуют друг другу, и дл€ создани€ более обозримого графика вдоль одной или обеих координатных осей приходитс€ выбирать логарифмический мас≠штаб. ƒл€ построени€ таких графиков используютс€ функции loglog (логарифмический масштаб по обеим ос€м), semilogx (логарифмический масштаб по оси x), semilogy (логарифмический масштаб по оси у).
| >> x=0:10:100; >> y=exp(x); >>semilogy(x,y) >> |
–езультат построени€ графика в логарифмическом масштабе приведен на
рис.3.2-8.
–ис. 3.2-8.√рафик с логарифмическим масштабом по оси у
ƒовольно интересной модификацией функции plot €вл€етс€ функци€ fplot, котора€ строит график функции y=f(x) без предварительного вычис≠лени€ векторов (x1,x2,Е) и (y1,y2,...). Ѕазовый формат вызова этой функции включает два аргумента:
fplot (@name_fun, [limits])
fplot (' name_fun', [limits])
¬ первом случае первым аргументом €вл€етс€ указатель на функцию с име≠нем name_fun, во втором случае - строка с именем обрабатываемой функ≠ции. јргумент limits может быть представлен либо двухкомпонентным век≠тором [xminхmах], либо четырехкомпонентным вектором [xminxmaxyminymax]. ”короченный вариант задает пределы изменени€ аргумента х, рас≠ширенный - дополнительно представл€ет пределы изменени€ функции. Ќапример:
fplot(@sin, [0 2*pi])
fplot('sin', [0 2*pi])
ѕо сравнению с plot функци€ fplot берет на себ€ вычисление таблицы значени€ функции, про€вл€€ при этом некоторый интеллект - в местах резкого изменени€ функции значени€ аргумента х выбираютс€ с более мел≠ким шагом. ‘ункци€ fplot гарантирует, что относительное уклонение вос≠производимой функции отличаетс€ от ее идеального графика не более чем на 0,2%. ≈сли вам нужен более точный или более грубый график, то после двух об€зательных аргументов в функции fplot можно задать желаемую от≠носительную погрешность - число, меньшее 1:
fplot(@sin, [0 2*pi], 0.05)
¬ этом случае гарантировано построение графика, отличающегос€ от иде≠альной кривой не более чем на 5%. ѕо умолчанию точность равна 2・10−3, и она определ€ет, на сколько точек делить интервал, чтобы погрешность от линейной интерпол€ции не превосходила этой заданной точности.
|
|
|
≈ще один дополнительный параметр Ч целое натуральное число n требует, чтобы функци€ fplot использовала при построении не менее чем n+1 точку. ќтносительна€ погрешность и количе≠ство точек могут задаватьс€ в любом пор€дке:
fplot(@sin, [0 2*pi], 0.05, 20)
fpiot(@sin, [0 2*pi], 20, 0.05)
Ќаконец, как и в функции plot, среди дополнительных параметров могут находитьс€ строки, управл€ющие цветом и маркировкой графика. ѕоследовательность задани€ всех дополнительных параметров Ц произвольна€. –е≠зультат выполнени€ следующего оператора приведен на рис. 3.2-16.
| >>fplot(@sin, [0 2*pi], 0.05, 's--') >> |
–ис. 3.2-9. —инусоида, построенна€ c помощью функции fplot
‘ункци€ fplot умеет возвращать значени€ компонентов векторов х и у, если к ней обратитьс€ следующим образом:
[х у] = fplot(@sin, [0 2*pi]);
¬ этом случае крива€ не рисуетс€, а соответствующие координаты занос€тс€ в массивы x и y соответственно.
‘ункци€ f, указываема€ в качестве первого аргумента fplot, кроме незави≠симой переменной х может содержать дополнительные параметры, например, y=f(x,a1,a2). “огда эти параметры указываютс€ среди дополнительных аргументов после задани€ относительной погрешности и минимального числа точек:
fplot('nanie_funТ, [xl х2], 0.05, 20, al, a2)
–ассмотрим ѕример 3.2-10, результат которого отображен на рис. 3.2 -10.
| >> subplot (1, 2,1); >>fplot('[tan(x),sin(x),cos(x)]',2*pi*[-l 1 -1 1]); >> subplot (2, 2,2); >>fplot('sin(l / x)', [0.01 0.1); >> |
–ис. 3.2-10. ѕримеры работы функции fplot
‘ункци€ fplot() предоставл€ет альтернативную возможность изображени€ функций по сравнению с вычислением вектора y по x и последующим изображением этой кривой с помощью функции plot(). Ёта функци€ бывает особенно полезной, когда крива€ имеет несколько разных скоростей изменени€ и заранее не €сно, в скольких и каких точках необходимо вычисл€ть и выводить кривую. Ётой функции необходимо передавать строку, описывающую требуемую функцию в виде f(x). —трока, описывающа€ f(x), может содержать любые допустимые в MatLab операции и/или функции. ‘ункци€ f(x) должна возвращать вектор той же размерности, что и x, или матрицу, каждый столбец которой имеет столько же элементов, сколько и x.
Ќапример, дл€ того чтобы нарисовать кривую y = sin(x)Хcos(2x) в диапазоне x от 0 до 5π, необходимо вызвать функцию fplot (Тsin(x).*cos(2x)Т, [0 5*pi]).
√рафик с двум€ ос€ми ординат (одна ось отображаетс€ слева, друга€ ось справа) реализуетс€ функцией plotyy(x1,y1,x2,y2) и той же функцией с добавлением параметров масштабировани€ 'f1' или 'f1','f2', в роли которых могут выступать plot, semilogx,semilogx, loglog (рис. 3.2-11).
| >> x=0:0.01:12*pi; >>plotyy(x,sin(x).*exp(-0.1.*x),x, 10*exp(-0.1.*x)) % |
–ис. 3.2-11. √рафическое окно с двум€ ос€ми координат
ƒл€ размещени€ различных надписей на полученном рисунке примен€ют функции xlabel, ylabel, title и text. ‘ункци€ xlabel предназначена дл€ размещени€ горизонтальной оси, функци€ ylabel Ц названи€ вертикальной оси. ƒл€ размещени€ надписи в произвольном месте рисунка используетс€ функци€ text, а общий заголовок дл€ графика выводитс€ функцией title. роме того, использу€ команду gridon можно нанести измерительную сетку.
–ассмотрим пример 3.2-12, результат которого приведен на рис. 3.2-12.
| >> x=1.5: 0.1: 2.5; >> y=sin(x); >> title (С√рафик sin(x)Т); >>xlabel(СосьхТ); >>ylabel(Сsin(x)Т); >> text(2.1,0.9,f(x)=sin(x)Т); >>grid on >>plot(x, y) >> |
–ис. 3.2-12
¬ системе MatLabсуществует функци€, котора€ создает ступенчатое изображение ваших данных. Ќапример, вместо соединени€ каждой пары точек из векторов аргументов пр€мыми лини€ми (как это делает функци€ plot() или line()) функци€ stairs() изображает ваши данные в виде горизонтальных отрезков на уровне yi, причем каждый отрезок горизонтальной линии длитс€ от i до i + 1, если обращение имеет вид stairs(y), и от xi до xi+1, если обращение имеет вид stairs(x,y). «начени€ xi не должны быть равноотсто€щими и не должны быть упор€дочены по возрастанию. ¬ывод графика на экран можно предотвратить, использу€ обращение вида [xs,ys]=stairs(x,y). ѕотом этот график может быть выведен на экран с помощью команды plot(),line() или другим каким-нибудь способом.

