


ƒл€ нахождени€ полюсов передаточной функции f можно использовать функцию:
>> p = pole (f)
¬ызов функции:
>> [w0,zeta,p] = damp (f)
позвол€ет найти не только полюса p, но также соответствующие им собственные частоты w0и коэффициенты демпфировани€ zeta в виде массивов.
Ќули передаточной функции f вычисл€ютс€ как
>> z = zero (f);
”стойчивость системы не зависит от расположени€ нулей, но они существенно вли€ют на переходные процессы. оманда:
>> pzmap (f);
строит карту расположени€ нулей (они обозначаютс€ кружками) и полюсов (крестики) системы на комплексной плоскости.
ѕередаточные функции типовых звеньев приведены в таблице 2 [6]:
Ќа практике часто требуетс€ найти эквивалентную передаточную функцию, которую можно получить путем сворачивани€ звеньев с использованием следующих правил.
ѕри последовательном соединении звеньев выходна€ величина каждого предыдущего звена €вл€етс€ выходной величиной дл€ последующего звена (–исунок 16, а).
ѕередаточна€ функци€ последовательно соединЄнных звеньев равна произведению передаточных функций отдельных звеньев (–исунок 16а) [6]:
 (29)
(29)
“аблица 2- ѕередаточные функции типовых звеньев
| є п.п. | Ќазвание звена | ѕ‘ звена |
| »нтегрирующие (») | 
| |
| ƒифференцирующие (ƒ) | 
| |
| ”силительное (”) (безынерционное) | 
| |
| јпериодическое 1-го пор€дка (ј) (инерционное) | 
| |
| јпериодическое 2-го пор€дка (ј2) (все корни вещественные) |  , , 
| |
| олебательное ( ) |  , ζ < 1. , ζ < 1.
| |
| онсервативное ( ќЌ) | 
| |
| »нтегрирующие с запаздыванием (реальное интегрирующие) (»«) | 
| |
| ƒифференцирующее с запаздыванием (реальное дифференцирующее) (ƒ«) | 
|
ѕараллельное соединение звеньев Ц соединение, при котором входна€ величина €вл€етс€ общей дл€ всех звеньев (–исунок 1, б). ѕередаточна€ функци€ параллельно соединЄнных звеньев равна сумме передаточных функций отдельных звеньев [6]:
 (30)
(30)
¬стречно Ц параллельное соединение звеньев, в состав которого входит положительна€ или отрицательна€ обратна€ св€зь (–исунок 16, в). ѕередаточную функцию дл€ такого соединени€ звеньев определ€ют по формуле [6]:
 (31)
(31)


а-последовательное; б-параллельное; в- встречно - параллельное
–исунок 16- —оединение звеньев
ƒл€ получени€ эквивалентной передаточной функции в среде Matlab нужно ввести требуемые функции с помощью команды tfи произвести необходимые преобразовани€ по формулам 29 Ц 31.
ќсновна€ часть команд вводитс€ в командном окне среды Matlab. оманды, которые надо примен€ть в других окнах, обозначены иконками соответствующих программ. ѕример выполнени€ задани€ рассмотрим на примере передаточной функции:
 (32)
(32)
5 ¬ыполнение анализа динамической системы в среде Matlab
Ётапы выполнени€ анализа динамической системы приведены в таблице 3
“аблица 3 -Ётапы выполнени€ анализа динамической системы
| Ётап выполнени€ задани€ | омандыMatlab |
| 1. ќчистите рабочее пространство Matlab (пам€ть). | clear all |
| 2. ќчистите окно Matlab. | clc |
| 3. ѕосмотрите краткую справку по команде tf. | help tf |
| 4. ќпределите адрес файла, который выполн€ет эту команду. | which('tf') |
| 5. ¬ведите передаточную функцию как объект tf.
| n = [n2 n1 n0] d = [1 d2 d1 d0] f = tf (n, d) |
| 6. ѕроверьте, как извлечь из этого объекта числитель и знаменатель передаточной функции. | [n1,d1] = tfdata (f, 'v') |
7. Ќайдите нули и полюса передаточной функции. 
| z = zero (f) p = pole (f) |
| 8. Ќайдите коэффициент усилени€ звена в установившемс€ режиме.
| k = dcgain (f) |
9. ќпределите полосу пропускани€ системы (наименьшую частоту, на которой ј„’ становитс€ меньше, чем  дЅ). дЅ).
| b = bandwidth (f) |
| 10. ѕостройте модель системы в пространстве состо€ни€.
| f_ss = ss (f) |
| 11. —делайте так, чтобы коэффициент пр€мой передачи звена был равен 1. | f_ss.d = 1 |
| 12. Ќайдите новый коэффициент усилени€ звена в установившемс€ режиме.
| k1 = dcgain (f_ss) |
13. ак св€заны коэффициенты  и и  ? ѕочему? ? ѕочему?
| |
| 14. ѕостройте модель исходной системы в форме Ђнули-полюсаї. | f_zp = zpk (f) |
| 15. ѕроверьте, какие переменные есть в рабочем пространстве. | who или whos (в чем разница?) |
| 16. ѕостройте на графике расположение нулей и полюсов системы. | pzmap (f) |
| 17. ќпределите коэффициенты демпфировани€ и собственные частоты дл€ всех элементарных звеньев (первого и второго пор€дка). | [wc,ksi,p] = damp (f) |
| 18. «апустите модуль LTIViewer. | ltiview |
| 19. «агрузите модель f. |  File Ц Import File Ц Import
|
| 20. ѕостройте импульсную характеристику (весовую функцию) этой системы. |
ѕ ћ Ц Plot Types - Impulse
|
| 21. «агрузите модель f_ss. | File Ц Import
|
| 22. ѕроверьте, построена ли импульсна€ характеристика второй системы? | ѕ ћ Ц Systems
|
| 23. ќтключите систему f. ѕочему одинаковы построенные импульсные характеристики разных систем? | ѕ ћ Ц Systems
|
| 24. ѕодключите обе системы. | ѕ ћ Ц Systems
|
| 25. ѕостройте переходные характеристики систем. |
ѕ ћ Ц Plot Types Ц Step
|
26. —делайте, чтобы на графике дл€ каждой функции были отмечены:
|
ѕ ћ Ц Characteristics:
|
| 27. ўелка€ мышью по меткам-кружкам, выведите на экран рамки с численными значени€ми этих параметров и расположите их так, чтобы все числа были видны. | |
| 28. Ёкспортируйте построенный график в отдельное окно. |
File Ц Print to Figure
|
| 29. —копируйте график в буфер обмена в формате векторного метафайла. | print -dmeta |
| 30. ¬ставьте график из буфера обмена в отчет (Microsoft Word). |  ѕ ћ - ¬ставить ѕ ћ - ¬ставить
|
| 31. «акройте окно LTIViewer. | |
32. —оздайте массив частот дл€ построени€ частотной характеристики (100 точек в интервале от  до до  с равномерным распределением на логарифмической шкале). с равномерным распределением на логарифмической шкале).
| w = logspace(-1, 2, 100); |
| 33. –ассчитайте частотную характеристику исходной системы Е | r = freqresp (f, w); r = r(:); |
| 34. Е и постройте ее на ос€х с логарифмическим масштабом по оси абсцисс. | semilogx (w, abs(r)) |
| 35. —копируйте график в буфер обмена в формате векторного метафайла. | print -dmeta |
| 36. ¬ставьте график из буфера обмена в отчет (Microsoft Word). ќбъ€сните, где на графике можно найти коэффициент усилени€ в статическом режиме и как определить полосу пропускани€ системы. | ѕ ћ Ц ¬ставить
|
| 37. «акройте все лишние окна, кроме командного окна Matlab. | |
| 38. ѕостройте сигнал, имитирующий пр€моугольные импульсы единичной амплитуды с периодом 4 секунды (всего 5 импульсов). | [u,t] = gensig('square',4); |
| 39. ¬ыполните моделирование и постройте на графике сигнал выхода системы f при данном входе. | lsim (f, u, t) |
| 40. —копируйте график в буфер обмена в формате векторного метафайла. | print -dmeta |
| 41. ¬ставьте график из буфера обмена в отчет (Microsoft Word). | ѕ ћ Ц ¬ставить
|
|
|
|
|
|
|
6 —оздание моделей в среде Simulink
ѕакет Simulink предназначен дл€ моделировани€ систем. ¬с€ модель строитс€ из блоков, имеющих входы и выходы. —уществует библиотека стандартных блоков, кроме того, можно создавать свои собственные блоки любой сложности.
—уществует две группы специальных устройств Ц источники сигналов (Sources) и устройства вывода (Sinks).
Ѕлоки имеют названи€. ƒл€ того, чтобы изменить название, надо щелкнуть по нему Ћ ћ и отредактировать текст.
аждый блок имеет свои настраиваемые свойства. ƒл€ их изменени€ надо дважды щелкнуть на блоке и изменить нужные значени€ в диалоговом окне.
ƒл€ того, чтобы повернуть блок на 90 градусов, надо выделить его и нажать клавиши Ctrl+R. омбинаци€ Ctrl+I позвол€ет выполнить зеркальное отражение входов и выходов.
¬ерхнее меню Formatпредназначено дл€ изменени€ оформлени€ выделенного блока. “акже дл€ этой цели можно использовать контекстное меню ѕ ћ Ц Format. ƒл€ выделенного блока можно изменить цвет текста и линий (Foreground color), цвет фона (Background color), вывести тень (Show drop shadow), переместить название на другую сторону (Flip name).
ƒл€ выделени€ одного блока или соединительной линии надо щелкнуть Ћ ћ по нужному элементу. ƒл€ того, чтобы выделить несколько блоков, надо Ђобвестиї их при нажатой Ћ ћ. лавиша Delete удал€ют выделенную часть. „тобы скопировать блок (или выделенную часть), надо перетащить его при нажатой правой кнопке мыши (ѕ ћ).
Ѕлоки соедин€ютс€ лини€ми св€зи, по которым распростран€ютс€ сигналы. ƒл€ того, чтобы соединить блоки, надо щелкнуть Ћ ћ по источнику сигнала и затем, при нажатой клавише Ctrl, по блоку-приемнику. ћожно также прот€нуть мышкой линию св€зи между нужными выходом и входом.
„тобы подать один сигнал на два блока (сделать Ђразвилкуї), надо сначала создать одну линию обычным способом. „тобы провести вторую линию, следует нажать правую кнопку мыши на линии в точке развилки и протащить линию ко второму блоку. ћодель можно скопировать в буфер обмена в виде растрового рисунка. ƒл€ этого в окне модели надо выбрать в верхнем меню пункт Edit Ц Copy model to clipboard. ѕредварительно лучше уменьшить размеры окна до минимальных, чтобы не было белых полей.
ƒл€ того, чтобы запустить моделирование, надо щелкнуть Ћ ћ по кнопке  на панели инструментов. Ёта же кнопка позвол€ет остановить моделирование при необходимости. ѕараметры моделировани€ (метод интегрировани€, обработка ошибок) устанавливаютс€ с помощью окна Simulation Ц Parameters. —амые важные параметры Ц это врем€ моделировани€ (Stop time) и метод численного интегрировани€ уравнений (Solver options). ќсновные источники сигналов (Sources) приведены в таблице 4.
“аблица 4 - ќсновные источники сигналов

| Constant Ц сигнал посто€нной величины. |

| Step Ц ступенчатый сигнал, мен€етс€ врем€ скачка (Step Time), начальное (Initial Value) и конечное значение (Final Value). |

| RampЦ линейно возрастающий сигнал с заданным наклоном (Slope). ћожно задать также врем€ начала изменени€ сигнала (Start Time) и начальное значение (Initial Value). |

| Pulse Generator Ц генератор пр€моугольных импульсов, задаютс€ амплитуда (Amplitude), период (Period), ширина (Pulse Width, в процентах от периода), фаза (Phase Delay). |

| Repeating Sequence Цпоследовательность импульсов, их форма задаетс€ в виде пар чисел (врем€; величина сигнала) |

| Sine WaveЦ синусоидальный сигнал, задаетс€ амплитуда (Amplitude), частота (Frequency), фаза (Phase) и среднее значение (Bias). |

| Signal Builder Ц построитель сигналов, позвол€ющий задавать форму сигнала, перетаскива€ мышью опорные точки. |

| Random Number Ц случайные числа с нормальным (гауссовым) распределением. ћожно задать среднее значение (Mean Value), дисперсию (Variance), период изменени€ сигнала (Sample Time). |

| Uniform Random NumberЦ случайные числа с равномерным распределением в заданном интервале от Minimumдо Maximum. |

| Band Limited White NoiseЦ случайный сигнал, ограниченный по полосе белый шум (имеющий равномерный спектр до некоторой частоты). Ѕлок используетс€ как источник белого шума дл€ моделей непрерывных систем. «адаетс€ интенсивность (Noise Power) и интервал дискретизации (Sample Time), в течение которого удерживаетс€ посто€нное значение сигнала. „ем меньше интервал, тем точнее моделирование, однако больше вычислительные затраты. |
ќсновные устройства вывода (Sinks) приведены в таблице 5
|
|
|
“аблица 5 Ц ќсновные устройства вывода

| DisplayЦ цифровой дисплей, показывает изменение входного сигнала в цифровом виде. |

| Scope Цосциллограф, показывает изменение сигнала в виде графика, позвол€ет передавать данные в рабочую область Matlab дл€ последующей обработки и оформлени€. |
Ћинейные системы (Continuous) приведены в таблице 6
“аблица 6 Ц Ћинейные системы

| Transfer FcnЦ передаточна€ функци€, в параметрах задаютс€ числитель (Numerator) и знаменатель (Denominator) в виде полиномов. |

| State SpaceЦ модель в пространстве состо€ний, в параметрах задаетс€ четверка матриц, определ€ющих модель, и начальные услови€ дл€ вектора состо€ни€ (Initial conditions). |

| Zero-PoleЦ модель в форме Ђнули-полюсаї, в параметрах задаютс€ массивы нулей (Zeros), полюсов (Poles), а также коэффициент усилени€ (Gain). |

| IntegratorЦ интегратор с возможностью установки начальных условий (Initial condition), а также пределов насыщени€ (Lower saturation limit и Upper saturation limit). огда сигнал выхода выходит за границы, определ€емые этими пределами, интегрирование прекращаетс€. |

| Derivative -Ѕлок вычислени€ производной, используетс€ как дифференцирующее звено. «начение входного сигнала блока до начала расчета считаетс€ равным нулю. Ќачальное значение выходного сигнала также полагаетс€ равным нулю. |
„асто используемые блоки приведены в таблице 7
“аблица 7 Ц „асто используемые блоки

| GainЦ усилитель, задаетс€ коэффициент усилени€ (Gain). |

| SumЦ сумматор, используетс€ дл€ сложени€ и вычитани€ входов. ѕараметр List of signs задает количество входов, их знаки (Ђ+ї дл€ сложени€ и ЂЦї дл€ вычитани€). ѕромежутки между входами (обозначаютс€ знаком |). |

| Trigonometric FunctionЦ тригонометрическа€ функци€. |

| Manual SwitchЦ ручной переключатель, позвол€ет двойным щелчком переключать выход на один из двух входных сигналов. |

| MuxЦ мультиплексор, объедин€ет несколько сигналов в один Ђжгутї (векторный сигнал), в параметрах задаетс€ число входов (Number of Inputs). |

| DemuxЦ демультиплексор, позвол€ет Ђразбитьї векторный сигнал на несколько скал€рных, в параметрах задаетс€ число выходов (Number of Outputs). |
Ѕлок осциллографа Scope
¬ окне блока Scope ( –исунок 17 ) изображаетс€ график изменени€ входного сигнала. ≈сли вход соединен с выходом мультиплексора, сразу строитс€ несколько графиков (по размерности входного Ђжгутаї).
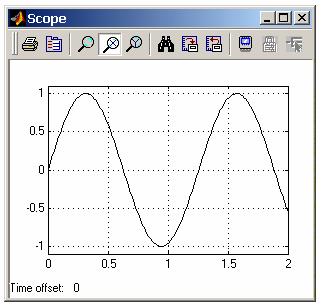
–исунок 17 Ц ќкно осциллографа Scope
ѕо умолчанию на оси ординат используетс€ диапазон от -5 до 5. ≈сли этот вариант не подходит, выбрать масштаб автоматически (так, чтобы весь график был виден) можно с помощью кнопки  . —оседн€€ кнопка
  сохран€ет эти настройки дл€ следующих запусков.
нопка  открывает окно настроек, причем наиболее важные данные содержатс€ на вкладке Data history. ≈сли не сбросить флажок Limit data points, в пам€ти будет сохран€тьс€ только заданное число точек графика, то есть, при большом времени моделировани€ начало графика будет потер€но.
|
|
|
ќтметив на этой же странице флажок Save data to workspace можно сразу передать результаты моделировани€ в рабочую область Matlab дл€ того, чтобы их можно было дальше обрабатывать, выводить на графики и сохран€ть в файле. ѕоле Variable name задает им€ переменной в рабочей области, в которой сохран€ютс€ данные. ¬ простейшем случае выбираетс€ формат Array (в списке Format). Ёто означает, что данные будут сохран€тьс€ в массиве из нескольких столбцов (первый столбец Ц врем€, второй Ц первый сигнал, третий Ц второй сигнал и т.д., по пор€дку входов мультиплексора).
ќформление графиков
ƒл€ создани€ нового окна дл€ рисунка в Matlab используетс€ команда
>> figure(1);
¬место единицы можно ставить любой номер рисунка. ≈сли рисунок с таким номером уже есть, он становитс€ активным и выводитс€ на первый план. ≈сли такого рисунка нет, он создаетс€ и становитс€ активным. Matlab
¬ Matlab есть возможность строить несколько графиков на одном рисунке. »наче говор€, рисунок можно разбить на Ђклеткиї, в каждой из которых строитс€ отдельный график. ƒл€ этого надо сделать активным нужный рисунок и применить команду:
>> subplot(2, 1, 1);
ѕервое число в команде subplot показывает количество Ђстрокї в такой матрице, второе Ц количество столбцов, третье Ц какой по счету график сделать активным (счита€ по строкам, справа налево и сверху вниз). ¬се дальнейшие команды (plot, title, xlabel, ylabel, legend и др.) относ€тс€ к этому Ђподграфикуї.
¬ командах можно передавать в качестве аргументов не целые массивы, а их части. Ќапример, по команде
>> plot(x(1:20), y(11:30));
строитс€ график, на котором по оси абсцисс откладываютс€ значени€ элементов массива x с номерами от 1 до 20, а по оси ординат Ц соответствующие им значени€ из массива y с номерами от 11 до 30.
ƒвоеточие означает Ђвсе строкиї или Ђвсе столбцыї. Ќапример, по команде
>> plot(x(:,1), x(:,2));
строитс€ зависимость между первым и вторым столбцами массива x (здесь двоеточие вместо первого индекса обозначает Ђвсе строкиї).
— помощью команды plot (а также и других подобных Ц semilogx, semilogy, loglog) можно строить несколько линий на одном графике. ƒл€ этого среди аргументов перечисл€ютс€ пары массивов:
>> plot(x, y, v, z);
ѕерва€ лини€ будет показывать зависимость y от x, а втора€ Ц зависимость z от v. массивы в каждой паре должны быть одинаковой длины. ѕри желании можно указать цвета дл€ каждой линии, Ќапример,
>> plot(x, y, 'b', v, z, 'g');
ѕерва€ лини€ (зависимость y от x) будет синей, втора€ (зависимость z от v) Ц зеленой. ћожно использовать следующие цвета: b -синий (blue ); g -зеленый (green); r -красный (red); c -голубой (cyan );m -фиолетовый (magenta); y -желтый (yellow); k -черный (black ).
ѕо умолчанию перва€ лини€ Ц син€€, втора€ Ц зелена€ и т.д. в пор€дке перечислени€ цветов в списке. ƒополнительно можно указать тип линии
- сплошна€
:точечна€
-.штрих-пунктирна€
--штрихова€
Ќапример,
>> plot(x, y, 'b:', v, z,'g--');
ѕерва€ лини€ Ц точечна€ синего цвета, втора€ Ц штрихова€ зеленого цвета. ѕо умолчанию все линии сплошные.
ƒл€ оформлени€ графика также используютс€ команды
title заголовок графика
xlabel название оси абсцисс
ylabel название оси ординат
” всех этих команд об€зателен один аргумент Ц текст в апострофах.
оманда legend служит дл€ вывода легенды графика. Ћегенда нужна, если на графике есть несколько линий и надо показать, что обозначает кажда€ из них. ѕараметрами команды legend €вл€ютс€ символьные строки, их должно быть столько, сколько построено линий. Simulink
7 ћоделирование линейной системы в пакете Simulink
7.1 ќписание линейной системы
–ассмотрим линейную систему управлени€, структурна€ схема, которой представлена на рисунке 18.

–исунок 18 - —труктурна€ схема системы управлени€
ѕередаточные функции имеют следующий вид:
 ; (33)
 ; (34)
 ; (35)
 . (36)
7.2 ¬ыполнение анализа линейной динамической системы в среде Simulink
ѕример выполнени€ исследовани€ линейной системы в среде Simulink представлен в таблице 8
“аблица 8 - ѕример выполнени€ исследовани€ линейной система в среде Simulink
| Ётап выполнени€ задани€ | оманды Matlab |
1 1 ƒл€ запуска пакета Simulink щелкните по кнопке  в командном окне Matlab или введите команду simulink в командной строке. в командном окне Matlab или введите команду simulink в командной строке.
| simulink |
| 2 2 —оздайте новую модель с помощью верхнего меню открывшегос€ окна Simulink Library Browser. |  File Ц New Ц Model
|
| 3 ѕеретащите блок Transfer Fcn (передаточна€ функци€) из окна Simulink Library Browser (группа Continuous) в окно модели и введите числитель и знаменатель передаточной функции модели. | ƒвойной щелчок на блоке
a. Numerator [K]
b. Denominator [  1 0] 1 0]
|
| 4 ƒайте блоку название W3. | Ћ ћ на имени блока |
5 јналогично добавьте еще три блока типа Transfer Fcn, назовите их W2, W1 и W4, введите нужные параметры. «аметьте, что передаточна€ функци€ привода должна быть  с учетом внутренней обратной св€зи. с учетом внутренней обратной св€зи.
| |
| 6 —охраните модель в своей папке под именем lab3.mdl. или под другим именем | File Ц Save |
| 7 ¬ыделите блок W4и разверните его в другую сторону. | Ќажать Ctrl+I или дважды нажать Ctrl+R. |
| 8 —делайте, чтобы названи€ блоков W1, W2иW3были над блоками. | ѕ ћ на блоке, Format - Flip name |
| 9 ¬ыберите цвет блоков на свой вкус. | ѕ ћ на блоке, Format Ц Background color |
| 10 ѕеретащите в окно модели блок Sum из группы Math Operations и установите его слева от W1. | Ћ ћ |
| 11 —делайте так, чтобы второй вход учитывалс€ в сумме со знаком минус (отрицательна€ обратна€ св€зь). | ƒвойной щелчок на блоке, ввести |+- в поле List of signs |
| 12 ѕеретащите в окно модели блок Step из группы Sources и установите его слева от сумматора. ƒайте ему им€ ¬’ќƒ. | |
| 13 ”становите врем€ подачи сигнала 0 и величину сигнала 10. | ƒвойной щелчок на блоке, 0 в поле Step time 10 в поле Final value |
| 14 —оедините все блоки нужным способом. | Ћ ћ на источнике, удерживать Ctrl и Ћ ћ на приемнике, или протащить Ћ ћ от выхода одного блока к входу другого |
| 15 ѕеретащите в окно модели два блока Scope (осциллограф) из группы Sinks и установите их в правой части. Ќазовите их —игн1 и —игн2. | |
| 16 —делайте, чтобы на первый блок Scope поступал сигнал c блока W2, а на второй ≠Ц сигнал c блока W3. —охраните модель. | Ќажать ѕ ћ на линии в точке отбора сигнала, затем, не отпуска€ ѕ ћ, тащить линию к входу блока. |
| 17 ”меньшите окно до минимального размера, при котором видны все элементы, и скопируйте модель в буфер обмена. «атем вставьте ее из буфера обмена в отчет. |  Edit Ц Copy model to clipboard

|
| 18 ”становите врем€ моделировани€ 100 секунд. |
Simulation Ц Simulation parameters
100 в поле Stop time
|
| 19 ¬ыполните моделирование. | Ћ ћ по кнопке
|
| 20 ѕосмотрите результаты моделировани€, открыв окна дл€ блоков —игн1и —игн2. |
ƒвойной щелчок по блоку
|
| 21 Ќастройте масштаб по ос€м в окнах обоих блоков, |  Ћ ћ по кнопке Ц установить оптимальный масштаб Ћ ћ по кнопке Ц установить оптимальный масштаб
|
| 22 —охраните настройки, | Ћ ћ по кнопке
|
| 23 —делайте так, чтобы результаты моделировани€ передавались с обоих блоков Scope в рабочую область Matlab в виде матриц, в которых первый столбец Ц врем€, а второй Ц сигнал (—игн1 или —игн2). |
Ћ ћ по кнопке
вкладка Data history

 Variable name:
Y1 (—игн1) или
Y2 (—игн2)
Format: Array
Variable name:
Y1 (—игн1) или
Y2 (—игн2)
Format: Array
|
| 24 ¬ыполните моделирование еще раз. | Ћ ћ по кнопке
|
| 25 ѕерейдите в командное окно Matlab и создайте новое окно дл€ графика. ¬ одном окне будут построены две кривых на разных ос€х. | figure(1); |
| 26 –азбейте окно на 2 части по вертикали и сделайте активным первый график. ѕервое число в команде subplotозначает количество €чеек с графиками по вертикали, второе Ц по горизонтали, третье Ц номер €чейки, которую надо сделать активной. | subplot(2, 1, 1); |
| 27 ѕостройте график изменени€ Y1. ¬ команде plot сначала указывают массив абсцисс, затем Ц массив ординат. ƒвоеточие означает, что используютс€ все строки. | plot(Y1(:,1),Y1(:,2)); |
| 28 ¬ведите заголовок графика. | title('y1'); |
| 29 ¬ведите названи€ осей координат. ¬нутри апострофов дл€ ввода греческих букв разрешаетс€ использовать команды LaTeX, | xlabel('¬рем€, сек'); ylabel('\Y1, V'); |
| 30 јналогично постройте во второй €чейке график изменени€ угла поворота рул€, использу€ данные из массива Y1, полученного в результате моделировани€. | subplot(2, 1, 2); plot(Y2(:,1),Y2(:,2)); title('¬ыходной сигнал'); xlabel('¬рем€, сек'); ylabel('Y2, V'); |
| 31 —копируйте построенный график в отчет. | print -dmeta |
|
|
|

