


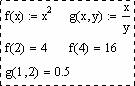
Mathcad допускает создание новых функций от одного и более аргументов. ќпределение функции записываетс€ в строчку в следующем пор€дке:
1. »м€ новой функции. Ќа имена функций распростран€ютс€ те же правила, что и на имена переменных.
2. —писок аргументов в круглых скобках через зап€тую.
3. —тандартный символ присваивани€ Ђ:=ї.
4. ¬ыражение, определ€ющее значение функции от аргументов.
ќбращение к функции записываетс€ в традиционной математической форме: упоминание имени функции, сразу после которого идет список значений аргументов в круглых скобках через зап€тую.
ѕример 1.
¬озможно построение следующих типов графиков:
1. Ћинейный (в пр€моугольных (декартовых) и пол€рных координатах).
2. ѕоверхность.
3. Ћинии уровн€ поверхности.
4. 3D столбикова€ диаграмма.
5. 3D точечный и векторный графики.
ƒл€ построени€ любого графика необходимо сначала определить на листе все данные, необходимые дл€ построени€, затем вставить на лист соответствующий графический регион и св€зать его с отображаемыми данными. ƒл€ вставки графического региона можно использовать соответствующие кнопки панели Math  Graph либо выбрать требуемый пункт в верхнем меню Insert Graph (¬ставка √рафик). —в€зь с отображаемыми данными производитс€ путем указани€ этих данных в позици€х ввода графического региона.
–ассмотрим более подробно команды меню Math Graph (слева изображены соответствующие кнопки панели Graph):
 X-Y Plot (ƒекартов график) клавиша @. —лужит дл€ построени€ графика функции y = f (x) в виде св€занных друг с другом пар координат (xi, yi) при заданном промежутке изменени€ дл€ i.
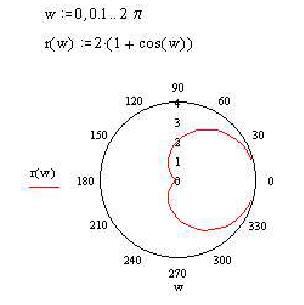
 Polar Plot (ѕол€рный график) клавиши Ctrl+7. —лужит дл€ построени€ графика функции r (q), заданной в пол€рных координатах, где пол€рный радиус r зависит от пол€рного угла q.
 Surface Plot (√рафик поверхности) клавиши Ctrl+2. —лужит дл€ представлени€ функции z = f (x, y) в виде поверхности в трехмерном пространстве. ѕри этом должны быть заданы векторы значений xi и yj, а также определена матрица вида Ai,j = f (xi, yj). »м€ матрицы A указываетс€ при заполнении рамки-шаблона.
 Contour Plot ( арта линий уровн€). —троит диаграмму линий уровн€ функции вида z = f (x, y), т. е. отображает точки, в которых данна€ функци€ принимает фиксированное значение z =const.
 3D Bar Plot (3D —толбикова€ гистограмма). —лужит дл€ представлени€ матрицы значений Ai,j или отображени€ значений функции z = f (x, y) в виде трехмерной столбчатой диаграммы.
 3D Scatter Plot (3D “очечный график). —лужит дл€ точечного представлени€ матрицы значений Ai,j или отображени€ значений функции z = f (x, y) в заданных точках. Ёта команда может также использоватьс€ дл€ построени€ пространственных кривых. ¬ этом случае при заполнении рамки-шаблона можно задать три координаты отдельными векторами одинаковой размерности в виде
  .
.
 Vector Field Plot (¬екторное поле). —лужит дл€ представлени€ двухмерных векторных полей V =(Vx, Vy). ѕри этом компоненты векторного пол€ Vx и Vy должны быть представлены в виде матриц. ѕри помощи этой команды можно построить поле градиента функции f (x, y).
|
|
|
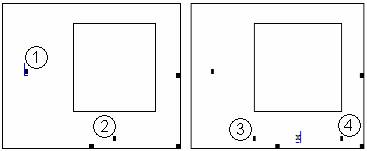
ƒвумерные графики. ƒл€ регионов линейных графиков (рис. 1) заполн€ютс€ две основные позиции ввода Ч слева и снизу от графика.
а) б)
–ис. 1. ¬ид региона дл€ линейного графика до (а) и после (б) заполнени€ одной из основных позиций ввода
¬ нижней позиции 2 указываетс€ выражение, определ€ющее значени€ абсцисс графика. ¬ыражение Ч им€ последовательности, вектора или обычной переменной. ћожет быть несколько выражений через зап€тую. ѕри необходимости можно указать в дополнительных позици€х 3 и 4 минимальное и максимальное значени€.
¬ позиции 1 указываетс€ выражение, определ€ющее значени€ ординат графика. ћожно перечислить несколько выражений через зап€тую Ч в этом случае будет построено несколько графиков в одних координатах. ¬ыражени€ обычно €вл€ютс€ функци€ми от аргумента, указанного в позиции 2. “ем не менее, могут быть построены и графики от двух функций заданных параметрически, в этом случае в позици€х 1 и 2 указываютс€ имена этих функций (рис. 2).
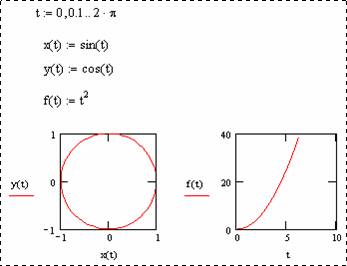
–ис. 2. ‘рагмент листа Mathcad с линейными графиками двух функций (параметрической (x (t); y (t)) и обычной f (t))
–ис. 3.
‘орматирование двумерных графиков. ƒл€ вывода окна форматировани€ двухмерного графика достаточно поместить указатель мыши в область графика и дважды щелкнуть левой кнопкой мыши. ¬ окне документа по€витс€ окно форматировани€ (рис. 4).
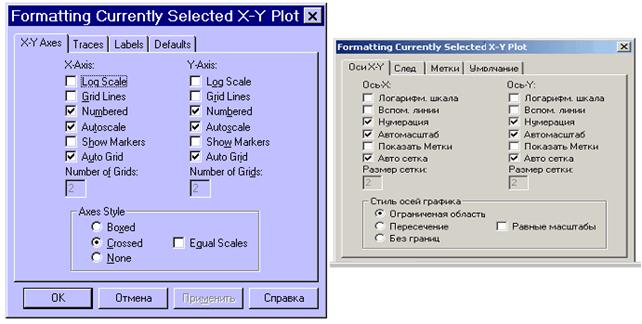
–ис. 4.
ќно имеет р€д вкладок:
Ч X-Y Axes (ќси X-Y);
Ч Traces (“рассировки);
Ч Labels (ћетки);
Ч Defaults (”молчание).
¬кладка становитс€ активной, если установить на ее им€ указатель мыши и щелкнуть левой кнопкой.
ѕерва€ из вкладок X-Y Axes (ќси X-Y) позвол€ет форматировать оси координат:
Ч Log Scale (Ћогарифмическа€ шкала) Ч задает логарифмические оси, в этом случае границы графика должны задаватьс€ положительными числами;
Ч Grid Lines (¬спомогательные линии) Ч задает отображение сетки;
Ч Numbered (Ќумераци€) Ч задает отображение подписи к маркировкам на ос€х;
Ч Autoscale (јвтомасштаб) Ч задает автоматическое нахождение подход€щих границ дл€ осей. Ќо если вы сами зададите в соответствующих €чейках минимальные и максимальные значени€ x min, x max, y min, y max, именно эти значени€ будут использоватьс€ дл€ определени€ границ графика;
Ч Show Markers (ѕоказать метки) Ч если установить эту опцию, то в графической области по€в€тс€ четыре дополнительные €чейки дл€ создани€ красных линий маркировки, соответствующих двум специальным значени€м x и двум специальным значени€м y;
Ч Auto Grid (јвто сетка) Ч при установке этой опции число линий сетки определ€ет Mathcad.
Ч Axes Style (—тиль осей графика) Ч группа кнопок этой области позвол€ет выбрать следующие варианты представлени€ осей: Boxed (ќграниченна€ область), Crossed (ѕересечение) Ч оси пересекаютс€ в точке с координатами (0; 0), None (Ѕез границ). ‘лажок Equal Scales (–авные масштабы) позвол€ет задать одинаковый масштаб дл€ обеих осей.
‘орматирование оси графика можно произвести, выполнив на ней двойной щелчок.
ƒл€ изменени€ типа линий графиков необходимо активизировать вкладку Traces (“рассировки)(рис. 5):
Ч Legend Lable (Ћегенда) Ч каждой кривой можно поставить в соответствие некоторый текст, называемый легендой. Ћегенда отображаетс€ в нижней части графической области, а р€дом с каждой легендой отображаетс€ тип линии соответствующей кривой;
|
|
|
Ч Symbol (—имвол) Ч позвол€ет выбрать символ дл€ каждой точки кривой (плюс, крестик, кружок и др.);
Ч Line (Ћини€) Ч можно выбрать один из следующих типов линий: solid (сплошна€), dash (штрихова€), dot (точечна€) или dadot (штрихпунктирна€). Ёто поле списка доступно в случае, если в поле Type (“ип) выбран элемент lines;
Ч Color (÷вет) Ч задаетс€ цвет представлени€ кривой на экране;
Ч Type (“ип) Ч позвол€ет выбрать один из видов графика: в виде линий, в виде точек и т. п.;
Ч Weight (¬ес) Ч позвол€ет задавать толщину линий графика.
–ис. 5.
¬ нижней части вкладки Traces расположены опции:
Ч Hide Arguments (—крыть аргументы) Ч эта опци€ по умолчанию отключена. ¬ этом случае под именем функции р€дом с осью ординат указываетс€ текущий тип линий. ≈сли установить данную опцию, указание типа линий исчезнет;
Ч Hide Legend (—крыть легенду) Ч по умолчанию легенда не отображаетс€. ≈сли вы хотите отобразить под графиком текст легенды, его необходимо перед этим ввести в поле Legend Lable (Ћегенда) и подтвердить ввод, выполнив щелчок на кнопке ѕрименить.
¬кладка Labels (ћетки) позвол€ет ввести заголовок графика и подписи дл€ осей (рис. 6).

–ис. 6.
¬ меню Format Graph (‘ормат √рафик) содержитс€ команда Zoom (»зменение масштаба). ѕри помощи этой команды можно увеличить фрагмент графика, предварительно выделив его протаскиванием мышки с нажатой левой клавишей. ѕосле отпускани€ клавиши координаты углов выделенной области будут отображены в пол€х окна X-Y Zoom (рис. 7). ѕри помощи кнопки Zoom (ћасштаб +) фрагмент можно увеличить, при помощи кнопки Unzoom (ћасштаб Ц) отменить выделение фрагмента, а при помощи кнопки Full View (ќбзор) Ч восстановить первоначальный вид графика. ≈сли вы увеличили фрагмент графика, то при щечке на кнопке OK в документе будет отображатьс€ только этот фрагмент.
–ис. 7.
“рехмерные графики. ѕостроение графика функции z = f (x, y) в виде поверхности в декартовой системе координат. ƒл€ построени€ графика поверхности можно воспользоватьс€ двум€ способами:
1. Ќеобходимо определить функцию f (x, y) и на панели Graph выбрать Surface Plot (√рафик поверхности). ¬ по€вившейс€ графической области под ос€ми на месте шаблона дл€ ввода надо указать им€ (без аргументов) функции. Ќезависимые переменные x и y принимают значени€ из промежутка [Ц5; 5] (рис. 8).
–ис. 8
ѕри необходимости этот промежуток может быть уменьшен или увеличен. ƒл€ этого необходимо дважды щелкнуть правой кнопкой мыши по выделенному графику и в по€вившемс€ окне 3D Plot Format (‘ормат 3D графика) на вкладке QuickPlot Data можно установить другие параметры изменени€ независимых переменных x и y (рис. 9).
–ис. 9.
2. ƒл€ построени€ графика поверхности в определенной области изменени€ независимых переменных или с конкретным шагом их изменени€ необходимо сначала задать узловые точки xi и yj, в которых будут определ€тьс€ значени€ функции. ѕосле (а можно и до) этого надо определить функцию f (x, y), график которой хотите построить. ѕосле этого необходимо сформировать матрицу значений функции в виде: Ai,j = f (xi, yj) (рис. 10).
“еперь после выполнени€ команды Graph Surface Plot в по€вившейс€ графической области достаточно ввести им€ матрицы (без индексов).
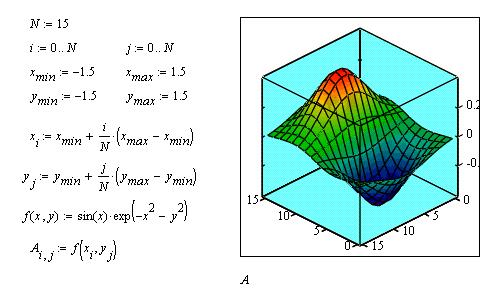
–ис. 10.
3. “акже дл€ построени€ графика поверхности в определенной области изменени€ независимых переменных или с конкретным шагом их изменени€ можно использовать функцию:
M:=CreateMesh(f,xn,xk,yn,yk,s1,s2),
где f Ч функци€, определ€юща€ поверхность; xn, xk, yn, yk Ч начальные и конечные значени€ независимых переменных x и у; s1, s2 Ч размерность сетки.
ѕосле выполнени€ команды Graph Surface Plot в по€вившейс€ графической области вводитс€ им€ переменной (в данном случае M).
ѕостроение графика кривой в пространстве. “рехмерные точечные графики можно использовать дл€ построени€ изображени€ пространственных кривых. ѕространственные кривые задаютс€, как правило, в виде (x (t), y (t), z (t)), где t представл€ет собой непрерывный действительный параметр (рис. 11).
|
|
|
ѕоскольку при построении трехмерной точечной диаграммы Mathcad позвол€ет отображать на графике только отдельные точки и соедин€ющие их линии, необходимо сначала определить три вектора координат Ч xi, yi, zi. ѕространственна€ крива€ создаетс€ командой Graph Scatter Plot.
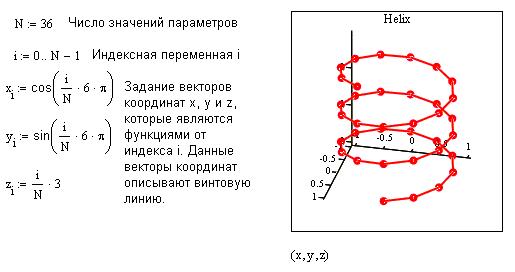
–ис. 11.
‘орматирование трехмерных графиков. ≈сли вас не устраивает внешний вид созданного трехмерного графика, вы можете изменить его, выполнив команду Format -> Graph -> 3D Plot или выполнив двойной щелчок мышкой на графической области. ¬ результате на экране по€витс€ диалоговое окно 3D Plot Format, позвол€ющее измен€ть параметры отображени€ графика. ћы рассмотрим здесь основные опции. –азобратьс€ во всех тонкост€х управлением видом графика вы можете самосто€тельно, построив график и поэкспериментировав, выбира€ те или иные опции.
ƒиалоговое окно 3D Plot Format содержит несколько вкладок (рис. 12).
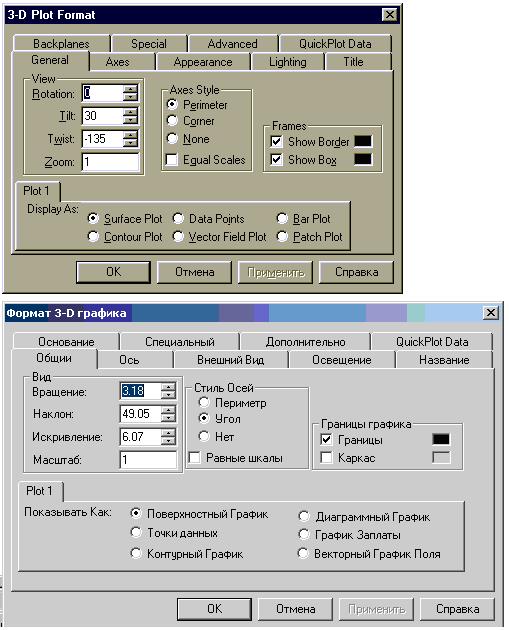
–ис. 12.
Ќа вкладке General (ќбщее):
Ч в области View (¬ид) можно задать направление взгл€да наблюдател€ на трехмерный график. «начение в поле Rotation определ€ет угол поворота вокруг оси Z в плоскости X - Y. «начение в поле Tilt задает угол наклона линии взгл€да к плоскости X - Y. ѕоле Zoom позвол€ет увеличить (уменьшить) графическое изображение в число раз, равное цифре, указанной в поле;
Ч в области Axes Style (—тиль осей) задать вид осей, выбрав селекторную кнопку Perimetr (ѕериметр) или Corner (”гол). ¬ первом случае оси всегда наход€тс€ на переднем плане. ѕри выборе кнопки Corner точка пересечени€ осей Ox и Oy задаетс€ элементом A 0,0 матрицы A;
Ч в области Frames (√раницы графика) опци€ Show box ( аркас) предназначена дл€ отображени€ вокруг графика куба с прозрачными гран€ми, а опци€ Show border (√раницы) позвол€ет заключить график в пр€моугольную рамку;
Ч в области Plot 1 (Plot 2...) Display as: (√рафик 1 ѕоказывать как:) имеютс€ селекторные кнопки дл€ представлени€ графика в других видах (контурный, точечный, векторное поле и др.);
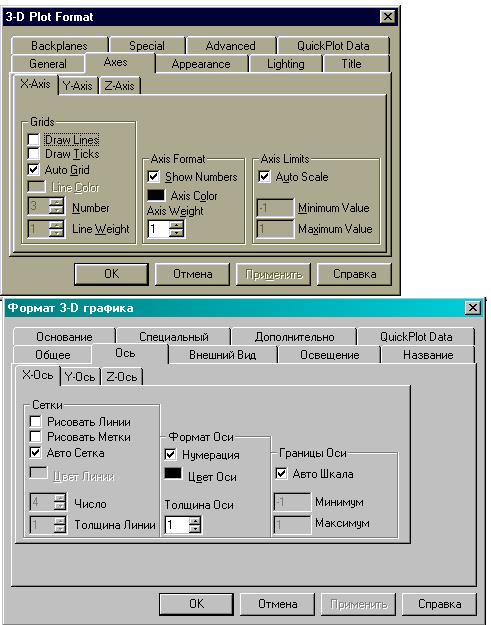
Ёлементы вкладки Axes (ќсь) позвол€ют измен€ть внешний вид осей координат (рис. 13).
–ис. 13.
ѕосредством опций области Grids (—етки) можно отобразить на графике линии, описываемые уравнени€ми x, y, z = const.
≈сли установлены опции Show Numbers (Ќумераци€), отображаютс€ метки на ос€х и подписи к ним.
ѕри этом р€дом с ос€ми Ox и Oy указываютс€ не значени€ узловых точек xi, yj, а значени€ индексов i и j, в то врем€ как ось Oz размечаетс€ в соответствии с промежутком, которому принадлежат элементы матрицы значений Ai,j.
≈сли установлена опци€ Auto Grid (јвто сетка), программа самосто€тельно задает рассто€ние между соседними отметками на ос€х. ¬ы можете сами указать число линий сетки, если отключите указанную опцию.
≈сли установлена опци€ Auto Scale (јвто шкала), то Mathcad сам определ€ет границы построени€ графика и масштабы по ос€м. ћожно отключить данную опцию и дл€ каждой оси самосто€тельно задать пределы изменени€ переменных в пол€х Minimum Value (ћинимум) и Maximum Value (ћаксимум).
¬кладка Appearance (¬нешний вид) позвол€ет измен€ть дл€ каждого графика вид и цвет заливки поверхности (область Fill Options); вид, цвет и толщину дополнительных линий на графике (область Line Options); наносить на график точки данных (опци€ Draw Points области Point Options), мен€ть их вид, размер и цвет.
¬кладка Lighting (ќсвещение) при включении опции Enable Lighting (¬ключить освещение) позвол€ет выбрать цветовую схему дл€ освещени€, установить несколько источников света, выбрав дл€ них цвет освещени€ и определив его направление.
¬кладка Backplanes (ќснование) позвол€ет изменить внешний вид плоскостей, ограничивающих область построени€: цвет, нанесение сетки, определение ее цвета и толщины, прорисовка границ плоскостей.
|
|
|
Ќа вкладке Special (—пециальный) можно измен€ть параметры построени€, специфичные дл€ различных типов графиков.
¬кладка Advansed (ƒополнительно) позвол€ет установить параметры печати и изменить цветовую схему дл€ окрашивани€ поверхности графика, а также указать направление смены окраски (вдоль оси Ox, Oy или Oz). ¬ключение опции Enable Fog (Ќаличие тумана) делает график нечетким, слегка размытым (полупрозрачным). ѕри включении опции Perspective (ѕерспектива) по€вл€етс€ возможность указать в соответствующем поле рассто€ние до наблюдател€.

