


MS Excel 1
ћета роботи:
ќзнайомитис€ з програмою MS Excel. ќтримати навички введенн€ даних та побудови таблиць. Ќавчитис€ працювати з формулами, функц≥€ми та д≥аграмами..
“еоретичний матер≥ал
1. јдреса ком≥рки
ожна ком≥рка маЇ власну, адресу €ка утворюЇтьс€ на перетин≥ стовпчика та р€дка та маЇ в≥дпов≥дне позначенн€ (л≥тера стовпчика та номер р€дка). јдреса ком≥рки в≥дображаЇтьс€ у верхньому л≥вому кут≥ програми п≥д панеллю ≥нструмент≥в (рис. 1).
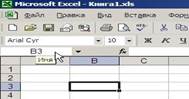
–ис.1. јдреса ком≥рки B3
2. ƒ≥апазон ком≥рок
ƒ≥апазон ком≥рок Ц це група сус≥дн≥х ком≥рок. ƒ≥апазон позначаЇтьс€ адресами верхньоњ л≥воњ та нижньоњ правоњ ком≥рок через двокрапку. Ќаприклад д≥апазон ком≥рок B2:D6 (рис. 2). ѕерша ком≥рка д≥апазону завжди вид≥лена б≥лим кольором (¬2).

–ис.2. ƒ≥апазон ком≥рок B2:D6
якщо необх≥дно вид≥лити дек≥лька ком≥рок або д≥апазон≥в, необх≥дно використовувати клав≥шу Ctrl (–ис. 3)
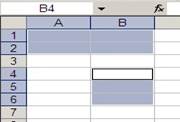
–ис. 3. ƒ≥апазони ком≥рок A1:B2 та B4:B6.
3. ‘ормула
‘ормула використовуЇтьс€ дл€ проведенн€ математичних розрахунк≥в. ‘ормула починаЇтьс€ з≥ знаку Д=Ф. Ќаприклад:
=ј1+ј2 (в цьому випадку до числа, €ке знаходитьс€ в ком≥рц≥ ј1, додаЇтьс€ число, €ке знаходитьс€ в ком≥рц≥ ј2)
=5+4 (в цьому випадку до 5 додаЇтьс€ 4)
ѕ≥сл€ введенн€ знаку Д=Ф адресу ком≥рки ј1 вказуЇмо курсором та л≥вою кнопкою миш≥, ставимо знак Д+Ф ≥ клацаЇмо л≥вою кнопкою миш≥ по ком≥рц≥ ј2.
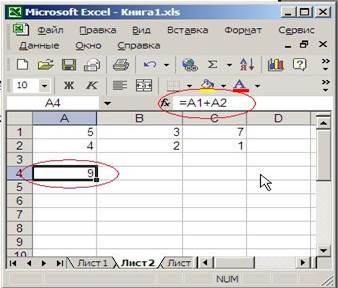
¬ ком≥рц≥, в €к≥й введена формула, в≥дображаЇтьс€ к≥нцевий результат. ўоб перегл€нути формулу, треба вид≥лити ком≥рку, формула буде в≥дображатис€ в –€дку формул. ¬ цьому ж р€дку формул можна в≥дредагувати формулу (–ис. 4).
–ис. 4. ¬ ком≥рц≥ ¬4 введена формула, €ка додаЇ значенн€ ком≥рки ј1 до ј2. ‘ормула ком≥рки ¬4 в≥дображаЇтьс€ в р€дку формул

4. ‘ункц≥€ автозаповненн€
‘ункц≥€ автозаповненн€ дозвол€Ї заповнювати область ком≥рок за певними правилами.
ћаркер автозаповненн€ знаходитьс€ в правому нижньому кут≥ вид≥леноњ ком≥рки / д≥апазону ком≥рок, та маЇ вигл€д чорного квадрату (–ис. 5).

–ис. 5. ћаркер автозаповненн€
ўоб скористатис€ функц≥Їю автозаповненн€, треба ввести в ком≥рку / д≥апазон ком≥рок дан≥ та пот€гти за маркер автозаповненн€. ѕри наведенн≥ курсору на маркер, курсор прийме вигл€д чорного хрестика.
ƒ≥њ, €к≥ будуть виконуватис€ при використанн≥ ц≥Їњ функц≥њ, будуть залежати в≥д даних, €к≥ введен≥ в ком≥рку, наприклад:
Ј якщо в ком≥рку ввести число або слово та пот€гти за маркер, то воно скоп≥юЇтьс€ (–ис. 6)

–ис. 6. оп≥юванн€ даних за допомогою функц≥њ автозаповненн€
Ј якщо в попередньому вар≥ант≥ задати крок, то функц≥€ автозаповненн€ продовжить ланцюг чисел. Ќаприклад задамо крок р≥вний 2. “од≥ кожне наступне число буде зб≥льшуватис€ на 2. ƒл€ цього вводимо в першу ком≥рку число 1, а в другу Ц число 3. ¬ид≥л€Їмо цей д≥апазон та т€гнемо за маркер автозаповненн€. ¬ результат≥ цих д≥й ми отримаЇмо стовпчик з непарних чисел (–ис. 7).


–ис. 7. —творенн€ р€ду чисел за допомогою функц≥њ автозаповненн€
Ј якщо в ком≥рку ввести день тижн€ або назву м≥с€ц€, то в наступних ком≥рках назви дн≥в тижн€ / м≥с€ц≥в будуть продовжуватис€. ¬ де€ких верс≥€х програми ц€ функц≥€ не працюЇ з украњнською мовою, тому назви м≥с€ц≥в та дн≥в тижн€ треба вводити рос≥йською мовою (–ис. 8).
|
|
|


–ис. 8. ¬веденн€ дн≥в тижн€ за допомогою функц≥њ автозаповненн€
Ј ѕри коп≥юванн≥ формули, адреси ком≥рок, €к≥ знаход€тьс€ в формул≥, будуть зм≥нюватис€ на сус≥дн≥ (–ис. 9).

–ис. 9. оп≥юванн€ формули
Ќа малюнку видно, що при коп≥юванн≥ формули вправо адреси ком≥рок ј1 та ј2 зм≥нилис€ на ¬1 та ¬2 в≥дпов≥дно.
якщо коп≥юванн€ формули в≥дбувалос€ б вниз, то адреси ј1 та ј2 зм≥нилис€ б на ј2 та ј3 в≥дпов≥дно.
Ј ƒл€ того, щоб при коп≥юванн≥ формули адреси ком≥рок не зм≥нювалис€, ≥снуЇ таке пон€тт€ €к абсолютне посиланн€.
¬игл€даЇ воно наступним чином:
=A1+$A$2
¬ ц≥й формул≥ посиланн€ на ком≥рку ј2 Ї абсолютним. ўоб зробити посиланн€ абсолютним, треба пом≥стити курсор м≥ж л≥терою ј та цифрою 2 та натиснути клав≥шу F4.
ѕри коп≥юванн≥ такоњ формули вправо, ј1 буде зм≥нюватис€ на ¬1, а ј2 буде залишатис€ незм≥нною (–ис. 10).


–ис. 10. ѕри коп≥юванн≥ формули за допомогою функц≥њ автозаповненн€, абсолютне посиланн€ не зм≥нюЇтьс€
5. ‘ункц≥њ
‘ункц≥њ Ц це вбудован≥ в програму MS Excel формули, €к≥ дозвол€ють проводити складн≥ обчисленн€, та покликан≥ скоротити час на побудову формул.
ожна функц≥€ маЇ ≥мТ€ та аргумент, €кий знаходитьс€ в круглих дужках. ¬с≥ доступн≥ функц≥њ знаход€тьс€ в ћастере функций, €кий викликаЇтьс€ в меню ¬ставка Ц ‘ункции. јргументом функц≥њ може бути число, адреса ком≥рки, д≥апазон ком≥рок, слова. Ќаприклад:
=—”ћћ(ј1:ј3) Ц знаходить суму чисел, €к≥ знаход€тьс€ в ком≥рках ј1, ј2 та ј3
=—–«Ќј„(ј1:ј3) Ц знаходить середнЇ значенн€ чисел, €к≥ знаход€тьс€ в д≥апазон≥ ком≥рок ј1:ј3
¬ ћастере функций вс≥ функц≥њ розбит≥ по категор≥€м (математичн≥, статистичн≥ тощо), мають коротке по€сненн€ та р€док пошуку (–ис. 11).

–ис. 11. ћайстер функц≥й
MS Excel дозвол€Ї створювати р≥зноман≥тн≥ д≥аграми. Ќайпрост≥шим способом створенн€ д≥аграми Ї використанн€ майстра д≥аграм, €кий викликаЇтьс€ командою Insert/¬ставка, Chart/ƒиаграмма(¬ставка, д≥аграма), або кнопкою Chart Wizard/ћастер диаграмм (ћайстер д≥аграм). ѕотр≥бний тип д≥аграми можна вибрати ≥з списку Chart type/“ип (“ип) вкладки Standart Types/—тандартные (—тандартн≥), або вкладки Custom Types (Ќестандартн≥). ¬ област≥ Chart sub-type/¬ид (¬игл€д) вибираЇтьс€ потр≥бний вигл€д д≥аграми.
MS Excel пропонуЇ так≥ основн≥ типи д≥аграм: Column charts (√≥стограми), Bar charts (Ћ≥н≥йн≥ д≥аграми), Line charts (√раф≥ки), Pie charts ( ругов≥ д≥аграми), XY (Scatter) charts (“очков≥ д≥аграми), Area charts (ƒ≥аграми з област€ми), Doughnut charts ( ≥льцев≥ д≥аграми) та ≥н.
≈лементами д≥аграми Ї маркери, легенди, ос≥, м≥тки, надписи та ≥н. ¬ид≥лити елемент д≥аграми можна за допомогою миш≥, перем≥стивши на нього вказ≥вник ≥ клацнувши л≥вою кнопкою.
–€д даних (Data Series/–€д данных) Ц це один р€док або один стовпчик даних, €к≥ в≥дображуютьс€ у д≥аграм≥ €к сукупн≥сть маркер≥в даних, таких €к стовпц≥, л≥н≥њ, сектори. ѕо замовчуванню д≥аграма будуЇтьс€ з р€дами у р€дках. ожен р€д даних в≥др≥зн€Їтьс€ кольором чи узором маркера.
ќр≥Їнтац≥€ даних (Series in/–€ды в) Ц це вказ≥вка про те, €к розм≥стити р€ди даних у робочому лист≥: чи по р€дках (rows/строках), чи по стовпц€х (columns/столбцах). ¬ибираЇтьс€ на вкладц≥ Data Range/ƒиапазон данных у пол≥ Range/ƒиапазон данных д≥алогового в≥кна Source Data/»сходные данные (ƒругий крок майстра д≥аграм чи ≥з контекстного меню област≥ д≥аграми вибирають в≥дпов≥дну команду). ¬≥д вибору ор≥Їнтац≥њ залежатиме, вм≥ст €ких ком≥рок буде використовуватис€ в €кост≥ ≥мен категор≥й ≥ тексту легенди.
|
|
|
¬ област≥ д≥аграми знаход€тьс€ вс≥ елементи д≥аграми (Chart Area), областю побудови д≥аграми Ї область лише д≥аграми (Plot Area).
“очка даних (Data Point/“очка данных) Ц це одиничний елемент даних у середин≥ будь-€кого р€ду даних.
ћаркер даних (Marker/ћаркер) Ц це граф≥чний елемент представленн€ точки даних (стовпчик, л≥н≥€, сектор, смуга тощо). ƒл€ того, щоб зм≥нити тип маркера Format Data Series/‘ормат р€дов данных (‘ормат р€ду даних) ≥з контекстного меню в режим≥ редагуванн€ д≥аграми дл€ вид≥леного р€ду даних в≥дкривають в≥кно, в €кому на вкладц≥ View/¬ид (¬игл€д) в област≥ Marker/ћаркер (ћаркер) актив≥зують режим Custom/ƒругой (≤нший) ≥ вибирають тип (Style/“ип маркера), кол≥р (Foreground/÷вет), фон (Background/‘он), розм≥р (Size/–азмер), з т≥нню чи без (Shadow/“ень).
Ћегенда (Legend/Ћегенда) Ц спец≥альн≥ по€сненн€ до маркер≥в або символ≥в, що використовуютьс€ у д≥аграм≥. јвтоматично створюЇтьс€ легенда ≥з назв, €к≥ розм≥щен≥ вздовж короткоњ сторони д≥апазону р€д≥в даних.
атегор≥€ даних (Category/ атегори€) Ц Ї групою даних ≥ переважно в≥дкладаЇтьс€ по ос≥ категор≥й. якщо визначено р€ди даних у р€дках таблиц≥, то категор≥њ Ї стовпчиками. ƒл€ включенн€ легенди в д≥аграму використовуЇтьс€ вкладка Legend/Ћегенда (Ћегенда) д≥алогового в≥кна Chart Options/ѕараметры диаграммы ((ѕараметри д≥аграми). ћожна також скористатис€ кнопкою Legend/Ћегенда (Ћегенда) на панел≥ ≤нструмент≥в Chart/ƒиаграмма ((ƒ≥аграма). ƒл€ вилученн€ легенди потр≥бно њњ вид≥лити ≥ натиснути на клав≥шу <Delete> або кнопку Legend/Ћегенда (Ћегенда) на панел≥ ≥нструмент≥в Chart/ƒиаграмма (ƒ≥аграма).
–озр≥зн€ють так≥ способи розм≥щенн€ легенди д≥аграми: Bottom/¬низу, посередине; Corner/¬ верхнем правом углу; Top/¬низу, посередине; Left/—лева, посередине; Right/—права, посередин≥; задаютьс€ вони в област≥ Placement/–азмещение (–озм≥щенн€) на вкладц≥ Legend/Ћегенда (Ћегенда) д≥алогового в≥кна, що в≥дкриваЇтьс€ командою Chart Options/ѕараметры диаграммы (ѕараметри д≥аграми) з≥ контекстного меню в режим≥ редагуванн€ д≥аграми.
ѕод≥лки (Tick mark/«асечки) Ц це маленьк≥ л≥н≥њ, що розбивають л≥н≥њ осей, €к розм≥тка на л≥н≥йц≥. ўоб додати заголовки д≥аграми, заголовки осей ≥ легенди командою Chart Options/ѕараметры диаграммы (ѕараметри д≥аграми) ≥з контекстного меню в режим≥ редагуванн€ д≥аграми в≥дкривають в≥кно, у €кому на вкладц≥ Title/«аголовки («аголовки) у пол≥ Chart Title/Ќазвание диаграммы зазначають назву д≥аграми, у пол€х Category(X) Axis/ќсь ’ (категорий), Value (Y) Axis/ќсь ” (значений) п≥дписи до осей X ≥ Y в≥дпов≥дно, на вкладц≥ Legend/Ћегенда (Ћегенда) включають режим Show legend/ѕоказывать легенду (ѕоказувати легенду).
¬ д≥аграму можна додавати текст, не пов'€заний з елементами д≥аграми, а також граф≥чн≥ об'Їкти, створен≥ за допомогою панел≥ ≥нструмент≥в Drawing (–исуванн€). «а допомогою вкладки Gridlines/Ћинии сетки (Ћ≥н≥њ с≥тки) д≥алогового в≥кна Chart Options/
ѕараметры диаграммы (ѕараметри д≥аграми) на д≥аграм≥ можна в≥добразити л≥н≥њ с≥тки Ч паралельн≥ ос€м л≥н≥њ, що проход€ть через основн≥ (Major/ќсновные) й допом≥жн≥ (Minor/ѕрормежуточные) под≥лки осей.
‘орматуванн€ об'Їкт≥в д≥аграми зд≥йснюЇтьс€ за допомогою д≥алогового в≥кна Format/‘ормат (‘ормат), що викликаЇтьс€ командою Format, Select object/ ‘ормат, выделенный объект (‘ормат, вид≥лений об'Їкт) або командою Format/ ‘ормат (‘ормат) ≥з контекстного меню вид≥леного об'Їкта.
MS Excel при створенн≥ плоских д≥аграм автоматично формуЇ в≥сь категор≥й (X) ≥ в≥сь значень (Y), а при створенн≥ об'Їмних д≥аграм в≥сь категор≥й (X), в≥сь р€д≥в даних (Y) ≥ в≥сь значень (Z). «ображенн€м цих осей на екран≥ можна керувати за допомогою вкладки Axes (ќс≥) д≥алогового в≥кна Chart Options/ѕараметры диаграммы (ѕараметри д≥аграми), що викликаЇтьс€ командою Chart, Chart Options/ƒиаграмма, ѕараметры диаграммы (ƒ≥аграма, параметри д≥аграми).
|
|
|
Ќалаштуванн€ осей передбачаЇ зм≥ну основних л≥н≥й, вибору розм≥щенн€ под≥лок. ¬оно проводитьс€ за допомогою вкладки Patterns/¬ид (¬игл€д) д≥алогового в≥кна Format Axis/‘ормат оси (‘ормат ос≥), що викликаЇтьс€ дл€ вид≥леноњ ос≥ командою Format Axis/‘ормат оси (‘ормат ос≥). ѕод≥лки можна розм≥стити всередину (Inside/¬нутрь), назовн≥ (Outside/Ќаружу) або представити такими, щоб перетинали в≥сь (Cross/ѕересекают ќсь). ћ≥тки под≥лок (Tick mark labels/ћетки делений) можуть розм≥щуватис€ пор€д ≥з в≥ссю (Next to axis/–€дом с осью), п≥д в≥ссю (Low/¬низу), над в≥ссю (High/¬верху), або не показувати њх (None/Ќет).
Ќа вкладц≥ Scale (Ўкала) д≥алогового в≥кна Format Axis (‘ормат ос≥) можна налаштувати шкалу ос≥ категор≥й (X) ≥ шкалу ос≥ значень (Y), а саме задати граничн≥ значенн€ (Minimum/ћинимальное значение, Maximum/ ћаксимальное значение), основн≥ ≥ допом≥жн≥ кроки (Major Unit/÷ена основных делений, Minor Unit/÷ена промежуточных делений).
¬ д≥аграму можна вставити м≥тки даних (Data Labels/ћетки данных), €кими можуть бути або значенн€ точок даних, або в≥дпов≥дн≥ до цих точок м≥тки ос≥ категор≥й (X). ƒл€ цього використовують вкладку Data Labels (ѕ≥дписи даних) д≥алогового в≥кна Chart Options (ѕараметри д≥аграми). ƒл€ того, щоб додати м≥тки значень командою Format Data Series/‘ормат р€дов данных (‘ормат р€ду даних) ≥з контекстного меню в режим≥ редагуванн€ д≥аграми дл€ вид≥леного р€ду даних в≥дкривають в≥кно, у €кому на вкладц≥ Data Labels/ѕодписи данных (ѕ≥дписи даних) в област≥ Data Labels/ѕодписи значений (ѕ≥дписи значень) актив≥зують режим Show Label/«начени€ («наченн€) або включають режим Show legend key next to Label/ люч легенды (ѕоказувати пор€д ≥з м≥тками ключ легенди).
ƒл€ зм≥ни рамок, кольор≥в ≥ в≥зерунк≥в об'Їкт≥в д≥аграми використовуЇтьс€ вкладка Patterns/¬ид (¬игл€д). Ќаприклад, кол≥р ≥ стиль маркер≥в, €к≥ використовуютьс€ дл€ позначенн€ точок даних, задаютьс€ на вкладц≥ Patterns/¬ид (¬игл€д) д≥алогового в≥кна Format Data Series/‘ормат р€дов данных (‘ормат р€ду даних), €ке викликаЇтьс€ командою Format, Selected Data Series/‘ормат, ¬ыделенный р€д (‘ормат, вид≥лений р€д).
–озм≥р шрифту текстового фрагмента на д≥аграм≥, його накресленн€, кол≥р, фон задаЇтьс€ на вкладн≥ Font (Ўрифт) д≥алогового в≥кна Format (‘ормат).
¬ир≥внюванн€ ≥ ор≥Їнтац≥€ тексту, розм≥щеного в д≥аграм≥, зд≥йснюЇтьс€ на вкладц≥ Alignment/¬ыравнивание (¬ир≥внюванн€) д≥алогового в≥кна Format/‘ормат (‘ормат).
‘орматуванн€ чисел в д≥аграм≥ зд≥йснюЇтьс€ на вкладц≥ Number/„исло („исло) д≥алогового в≥кна Format Axis/‘ормат оси (‘ормат ос≥), €ке викликаЇтьс€ дл€ вид≥леноњ ос≥ командою Format Axis/‘ормат оси (‘ормат ос≥).
«м≥на параметр≥в в≥дображенн€ граф≥чних об'Їкт≥в в д≥аграм≥ зд≥йснюЇтьс€ за допомогою д≥алогового в≥кна Format AuloShape/‘ормат автофигуры (‘ормат автоф≥гури), що викликаЇтьс€ командою Format, Selected Object/‘ормат, выделенный объект (‘ормат, вид≥лений об'Їкт).
ƒл€ зм≥ни ракурсу обТЇмних д≥аграм використовують команду Chart, 3-D View/ƒиаграмма, ќбъЄмный вид (ƒ≥аграма, ќбТЇмний вигл€д). ” однойменному д≥алоговому в≥кн≥ задають висоту огл€ду д≥аграми (Elevation/¬озвышение), кут повороту (Rotation/ѕоворот), вказують сп≥вв≥дношенн€ переднього й заднього плану (Perspective/ѕерспектива), висоту вертикальноњ ос≥ (Z) у в≥дсотках до ширини д≥аграми по ос≥ (X) (Height % of Base/¬ысота % нормальной), значенн€ осьових кут≥в установлюють р≥вними 90о (Right Angle Axis/»зометри€).__
ѕрактичне завданн€ 1
1. ¬веденн€ даних
|
|
|
Ј ¬ кл≥тинку ј1 ввести пр≥звище, ≥мТ€ та по батьков≥. –озширити стовпчик ј так, щоб введен≥ дан≥ повн≥стю було видно.
Ј ” кл≥тинку ј2 ввести групу.
Ј ¬ кл≥тинки ¬1, ¬2, ¬3, ¬4 ввести числа 25; -10; 12,25; 0,001.
Ј ¬ кл≥тинку —1 ввести дату народженн€.
Ј ¬ кл≥тинку —2 ввести поточну дату.
2. ¬вести засобом автозаповненн€
Ј в кл≥тинки D1:D20 числа з 1 до 20.
Ј в кл≥тинки ≈1:≈20 непарн≥ числа починаючи з 5.
Ј в кл≥тинки F10:F20 дн≥ тижн€.
Ј в кл≥тинки G1:G12 ввести м≥с€ц≥.
3. ѕерейти на Ћист 2 та порахувати наступну таблицю:

ƒл€ цього:
значенн€ дл€ х та у заповнити за допомогою функц≥њ автозаповненн€;
в ком≥рки C2, D2, E2, F2 ввести формули, €к≥ зазначен≥ на малюнку;
скоп≥ювати введен≥ формули в нижн≥ ком≥рки (на м≥сце знак≥в "?") засобом автозаповненн€;
в ком≥рки A22 та F22 ввести функц≥њ, €к≥ зазначено на малюнку.
4. ƒл€ д≥апазону ком≥рок F2:F22 задати в≥дсотковий формат, к≥льк≥сть знак≥в п≥сл€ коми Ц 2.
ƒл€ цього треба вид≥лити д≥апазон ком≥рок, зайти в меню ‘ормат => ячейки => „исло => ѕроцентный => „исло дес€тичных знаков => 2.
—творити наступну таблицю:

"..." - ввести будь-€к≥ числа
"?" - ввести формули
ƒл€ цього:
ќб'Їднати ком≥рки ј1:F1. ƒл€ цього треба вид≥лити ц≥ ком≥рки та натиснути кнопку "ќбъединить и поместить в центре"

¬вести у об'Їднан≥ ком≥рки назву таблиц≥.
ќб'Їднати наступн≥ групи кл≥тинок: A2:A3, B2:B3, C2:F2.
ƒл€ р€дку "% виконанн€ плану" (ком≥рки B7:F7) встановити в≥дсотковий формат. ƒл€ цього треба вид≥лити ц≥ ком≥рки, зайти в меню "‘ормат", пункт "ячейки", вкладка "„исло", числов≥ формати "ѕроцентный".
«ам≥сть трьох крапок ввести будь-€к≥ числа (оборот магазину за квартал).
«ам≥сть знак≥в питанн€ ввести розрахунков≥ формули:
¬≥дхиленн€ в≥д плану = планове завданн€ - фактично виконано
% виконанн€ плану = фактично виконано / планове завданн€
—товпчик "¬сього за р≥к" знаходитьс€ за допомогою функц≥њ —”ћћ:
Ќаприклад:
=—умм(—3:F3) - всього за р≥к планове завданн€
"¬сього за р≥к" в р€дку "% виконанн€ плану" знаходитьс€ за формулою: фактично виконано / планове завданн€
ƒл€ показник≥в "ѕланове завданн€" та "‘актично виконано" побудуЇмо д≥аграму. ¬ д≥аграм≥ повинн≥ бути присутн≥ п≥дпис даних, легенда. ƒ≥аграма повинна розташовуватис€ на окремому аркуш≥.
ѕерейти на наступний аркуш.
«айти в меню "¬ставка", пункт меню "ƒиаграмма".
¬ибрати пункт "√истограмма" та натиснути кнопку "ƒалее".
” в≥кн≥ "ћастер диаграмм" на вкладц≥ "ƒиапазон данных" в р€дку "ƒиапазон" ввести д≥апазон кл≥тинок C4:F5. ƒл€ цього треба поставити курсор в р€док "ƒиапазон", пот≥м клацнути на ком≥рку —4 ≥, не в≥дпускаючи кнопку миш≥, провести курсором до ком≥рки F5.


ѕерейти на вкладку "–€д" та вказати ≥мена р€д≥в та п≥дпис ос≥ ’

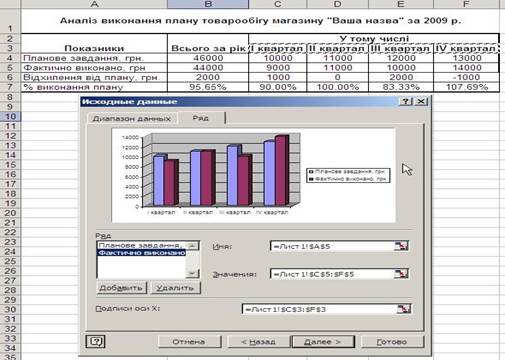
Ќа вкладц≥ "«аголовки" ввести назву д≥аграми "¬иконанн€ плану товарооб≥гу" (без лапок). ¬казати ≥нш≥ необх≥дн≥ параметри. Ќатиснути кнопку "ƒалее".
3. ѕобудувати колову д≥аграму дл€ показнику "ѕланове завданн€". ƒоповнити д≥аграму назвою, легендою, п≥дписами даних. –озташувати д≥аграму пор€д з попередньою г≥стограмою.
4. Ќа ≥ншому аркуш≥ створити наступну таблицю:

5. “аблиц€ повинна мати 15 маршрут≥в. ¬≥дсутн≥ маршрути (з 2 по 14) необх≥дно придумати самост≥йно.
6. ” стовпчик "“елефон" номер телефону повинен автоматично розд≥л€тис€ деф≥сом, при цьому цифри будуть групуватис€ по 2 цифри. ƒл€ цього треба зробити власний формат:
«айти в меню "‘ормат", пункт "ячейки", "„исло", "¬се форматы".
7. ћ≥ж стовпчиками "“ривал≥сть" ≥ "¬≥дправленн€" вставити стовпчики "ѕрограма" ≥ "“ранспорт", м≥ж "¬≥дправленн€" ≥ "¬арт≥сть" - стовпчик "ѕроживанн€". «аповнити нов≥ стовпчики.
8. «аф≥ксуйте стовпчик "¬". ƒл€ цього зайд≥ть в меню "ќкно", пункт "«акрепить области". ѕерегл€ньте ≥нш≥ стовпчики за допомогою л≥н≥йок прокрутки.
9. «астосуйте до таблиц≥ автоформатуванн€ (ћеню "‘ормат", пункт "јвтоформат").
«берегти роботу.

