


1. ¬еличины стандартных ошибок коэффициентов регрессии приведены в поле Std.Error (рис. 1.1). ќни показывают, насколько в среднем значение случайной величины отклон€етс€ от его математического ожидани€. ¬ поле Prob Ц указываетс€ –-значение Ц веро€тность того, что гипотеза о незначимости коэффициента верна.
Ј ƒл€ константы –-значение равно 0,0022, что говорит о том, что коэффициент значим на уровне значимости 0,01 на уровне довери€ = 99%.
Ј ƒл€ образовани€: –-значение равно 0,0005, что говорит о том, что коэффициент значим на уровне значимости 0,01 на уровне довери€ = 99%
2. ƒоверительные интервалы коэффициентов определ€ютс€ с помощью полей Coefficient и Std.Error.
Ј онстанта: доверительный интервал дл€ 1% =[4860,86-1575,78*2,58; 4860,86+1575,78 *2,58] = [795,35; 8926,41]; дл€ 5% =[4860,86-1575,78*1,96; 4860,86+1575,78 *1,96] = [1772,33; 7949,39] и дл€ 10% =[4860,86-1575,78*1,65; 4860,86+1575,78*1,65]= [2260,823; 7460,897].
Ј ќбразование: доверительный интервал дл€ 1% =[315,55-90,05*2,58; 315,55+90,05*2,58] = [83,22; 547,879]; дл€ 5% =[315,55-90,05*1,96; 315,55+90,05*1,96] = [139,05;492,05 ] и дл€ 10% =[315,55-90,05*1,65; 315,55+90,05*1,65] = [166,97;464,13].
3. оэффициент детерминации приводитс€ в поле R-squared = 0,035981. ƒанный показатель значит, что на 3, 6% изменение переменной salary определ€етс€ изменением переменной education, и на 96,4% изменение переменной salary определ€етс€ изменением других факторов.
4. —тандартна€ ошибка регрессии S (поле S.E. of regression) может сравниватьс€ со средним значением зависимой переменной в поле Mean dependent var. „ем меньше значение S по отношению к среднему значению зависимой переменной, тем лучше качество модели. ¬ нашем случае S = 5999,47 и Mean dependent var = 10260,51, говорит о том, что качество модели неплохое.
5. ¬ поле Prob(F-statistic) приводитс€ веро€тность того, что гипотеза о незначимости уравнени€ верна. ¬ нашем случае Prob(F-statistic) = 0,000521, значит уравнение значимо на уровне значимости 0,01 (на уровне довери€ 99%).
6. ƒл€ определени€ средней абсолютной процентной ошибки в окне Equation нажимаем кнопку Forecast, в новом окне нажимаем OK.
¬ результате в окне рабочего файла по€вилс€ р€д теоретических значений зависимой переменной (SALARYF), а в окне Equation отобразились графики фактических и теоретических значений зависимой переменной (рис. 1.3).
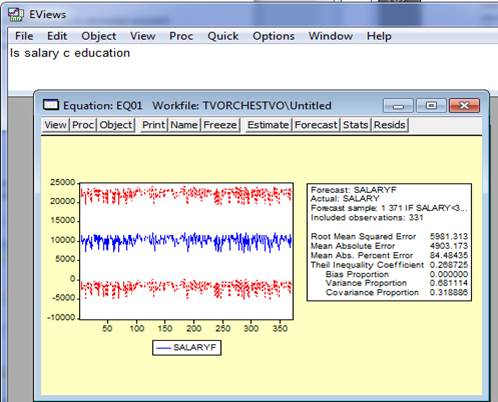
–ис. 1.3
¬ таблице справа значение пол€ Mean Abs. Percent Error и есть значение средней абсолютной процентной ошибки = 84,48, что €вл€етс€ достаточно большим значением и указывает на плохое качество подгонки уравнени€.
ѕроверим качество построенного уравнени€ регрессии. ƒл€ этого в окне Equation выбираем меню View => Actual, Fitted, Residual=> Actual, Fitted, Residual Graph. ѕеред нами открываетс€ окно (рис. 1.4)

–ис. 1.4
ачество уравнени€ считаетс€ хорошим, если графики фактических (Actual) и прогнозных (Fitted) данных близки, и график остатков (Reaidual) показывает небольшие значени€ относительно значений зависимой переменной (заработной платы). ѕолучаетс€, что качество уравнени€ можно считать хорошим.

