


ћатематическому выражению, над которым будут производитьс€ преобразовани€ можно присвоить им€. Ќапример, сделав запись
> P:=x^2+2*x+3
P:=x2+2x+3

–ис. 2. онтекстное меню
¬ дальнейшем, к данному выражению можно обращатьс€ по этому имени.
> P^2
(x2+2x+3)2
ѕо нажатию правой клавиши мыши, можно вызвать контекстное меню (рисунок 2), в котором пользователю предлагаютс€ основные математические операции возможные с данным выражением, такие как дифференцирование (Differentiate), интегрирование (Integrate), разложение на множители (Factor), упрощение (Simplify), решение уравнени€ в случае равенства нулю (Solve), разложение в р€д по степен€м x (Series), двумерные и трехмерные графики (Plots), раскрытие скобок (Expand), приведение подобных членов (Collect) и др.
‘ункци€ от одной или нескольких переменных в программе Maple задаетс€ следующим образом
>f:=x->x^2+4
f:=x->x^2+4
Ёту же структуру, можно выбрать на палитре Expression.
–ассчитаем значени€ функции при различных значени€х аргумента:
> f(2)+f(1)^2-8
25
»нтерфейс справочной системы
 –ис. 3. »нтерфейс справочной системы
Maple снабжен мощной диалоговой системой контекстной помощи. ќкно справочной системы показано на рисунке 3:
ƒл€ получени€ справки по конкретной команде, следует в контекстном меню выбрать пункт Help on Command.
јнализ ошибок (Error)
¬ р€де случаев возникают ошибки выполнени€ вводимых команд. ƒл€ установлени€ причины ошибки необходимо перейти по гиперссылке, нажав на сообщение об ошибке (требуетс€ подключение к сети »нтернет).
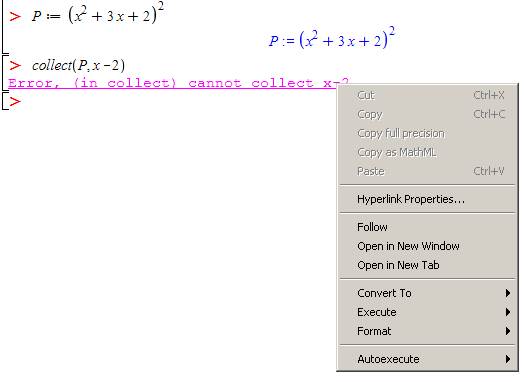
–ис. 4. ѕереход по гиперссылке из контекстного меню
ѕостроение графиков
ƒл€ построени€ двумерных графиков функций в Maple используетс€ графическа€ библиотека plots, и встроенна€ функци€ plot(выражение, диапазон значений аргумента по горизонтальной оси, диапазон значений аргумента по вертикальной оси, цвет, толщина линий). ѕри этом об€зательными параметрами €вл€ютс€ выражение и диапазон значений аргумента по горизонтальной оси. ƒиапазон значений аргумента по горизонтальной оси задаетс€ в виде х = хmin..хmax.. ƒиапазон значений аргумента по вертикальной оси задаетс€ в виде у = ymin. .уmax..
Ќапример, пусть требуетс€ построить график функции у = cos(x) на отрезке (-2π, 2π). ƒл€ построени€ указанного графика необходимо ввести
> plot(cos(x), х = -2*Pi..2*Pi);
–езультат выполнени€ функции plot() представлен на рис. 4.

–ис. 4. ѕостроение графика функции cos(x)
¬ыделив полученный график щелчком левой кнопкой мыши, можно изменить его размер. ≈сли щелкнуть по графику правой кнопкой мыши, то по€витс€ контекстное меню дл€ его форматировани€. — помощью контекстного меню график можно заключить в рамку, изменить вид координатных осей, изменить толщину, тип или цвет линий, а также добавить заголовок графика и легенду.

–ис.5. онтекстное меню дл€ форматировани€ графика
≈сли функци€ принимает бесконечное значение в какой-либо точке (т.е. имеет точку разрыва второго рода), то в списке аргументов встроенной функции plotQ следует указать дополнительный параметр discont = true. роме того, может потребоватьс€ ограничить диапазон отображени€ графика по вертикальной оси. Ќапример, построим график функции у = tg(x) на отрезке (-π, π ). ƒл€ этого в командной строке вводим:
|
|
|
>plot(tan(x), х = -Pi..Pi, discont = true);
ѕолученный график представлен на рис. 6.

–ис.6. ѕостроение графика функции tg(x)
ƒл€ построени€ графика функции, заданной параметрически, используетс€ следующий формат функции plot():
Plot([func1(t),func2(t), t = a..b], <options>),
где func1(t), func2(t) Ч функции координат, завис€щие от параметра; (а, b) Ч интервал изменени€ параметра. ѕараметр options включает в себ€ дополнительные опции; например, numpoints Ч дл€ указани€ числа точек при построении кривой; coords Ч дл€ указани€ типа системы координат; title Ч дл€ введени€ заголовка и т.д. ѕри построении графика функции, заданной в пол€рных координатах, в списке параметров указываетс€ coords = polar.
Ќапример, нам необходимо построить график

ƒл€ этого в командной строке вводим:
>plot ([sin(2*t), cos(3*t), t = 0..4*Pi]);
ѕолученный график представлен на рис. 7.
* 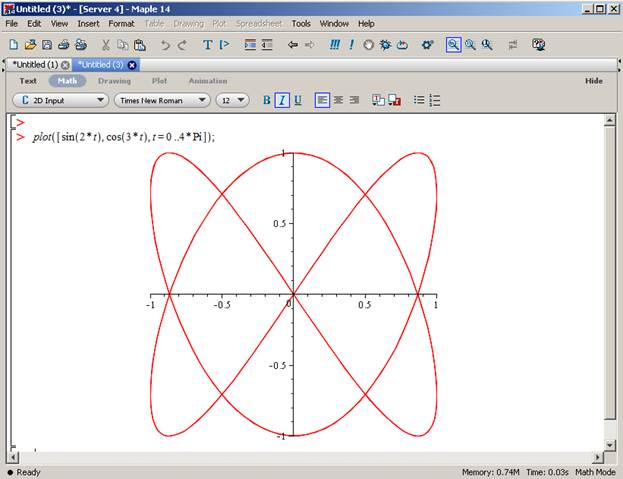
–ис.7. ѕостроение функции, заданной в параметрической форме
ƒл€ доступа к другим встроенным функци€м пакета plots в командной строке вводим:
> with(plots)
открываем пакет. Ќа экране отобразитс€ перечень графических функций пакета plots (рис.8), дл€ изучени€ которых можно обратитьс€ к справочной системе Maple 14. ¬ыделив любую функцию списка и нажав <F1>, пользователь попадает на страницу системы Help с описанием этой функции и примерами еЄ применени€.

–ис. 8. ѕеречень функций библиотеки plots.
Ќапример, команды implicitplot, implicitplot3d - разработаны дл€ отображени€ не€вных функций. »х синтаксис схож с синтаксисом команды plot. ƒл€ отображени€ графика функций, заданной в пол€рной системе координат, в пакете plots существует функци€ polarplot(). ≈е синтаксис похож на синтаксис команды plot() за одним исключением - не задаетс€ третий параметр, ограничивающий диапазон изменени€ значений, в данном случае длины радиус-вектора: polarplot(r, phi=диапазон, опции).
ѕостроение поверхностей происходит аналогично построению кривых на плоскости. √рафическа€ функци€, предназначенна€ дл€ построени€ поверхностей, имеет следующий формат:
plot3d(f(x, у), х = а..b,у = c..d),
где f{x,y) Ч функци€, график которой требуетс€ построить; диапазоны значений аргументов х и у задаютс€ в виде х = а..b, у = c..d.
ѕараметрически заданные поверхности стро€тс€ с помощью функции plot3d(), имеющей формат:
plot3d([f1 (u, v),f2(u, v),f3(u,v)], u = a..b,v = c..d]).
где f1(u, v),f2(u, v),f3(u, v) Ч функции координат, завис€щие от параметра; а..b, c..d Ч интервалы изменени€ параметров.
ѕусть требуетс€ построить параболоид, заданный уравнением z = х2 +y2. ¬ командной строке вводим
>plot3d(x^2 + у^2, х = -1..1,у = -1..1);
ѕолученный график представлен на рис.9.

–ис. 9. ѕараболоид
‘орматирование трехмерного графика осуществл€етс€ аналогично форматированию двумерного графика с помощью контекстного меню. “ак, дл€ добавлени€ координатных осей щелкаем правой кнопкой мыши по графику и, открыв контекстное меню, переходим на строку Axes, затем в ниспадающем меню выбираем, например, вид координатных осей Normal. «аметим, что после щелчка левой кнопкой мыши по графику указатель мыши мен€ет свой вид на изогнутую стрелку. ”держива€ левую кнопку мыши, можно повернуть трехмерный график так, чтобы получить наилучший угол обзора.
|
|
|
| ƒополнительно ко всем известным опци€м команды plot() нужно отметить опцию grid=[m,n], определ€ют сетку из m*n точек, на которой вычерчиваетс€ крива€. |
ѕри увеличении количества точек в сетке крива€ отбражени€ становитс€ более гладкой без угловых точек. ѕо умолчанию используетс€ сетка 25*25 точек.

