


ѕример расчетной матрицы двухуровневого двухфакторного эксперимента представлен на рисунке 2.1.
ƒл€ ввода уравнени€, дл€ которого необходимо произвести расчет коэффициентов, необходимо перейти из раздела ЂBasic Statistics/Tablesї в раздел

| ЂMultiple Regressionї и открыть окно ЂFunction to be estimated & loss functionї ћодель первого пор€дка (линейна€ модель) дл€ двухфакторного эксперимента имеет следующий вид: |
| –исунок 2.1 |
y=a0+a1*x1+a2*x2+a12*x1*x2.
ѕосле введени€ формулы на всех последующих окнах нужно просто нажимать Ђќ ї, пока не по€витс€ окно-таблица ЂModelї с численными значени€ми коэффициентов модели. ƒл€ получени€ графического изображени€

| функциональной зависимости в окне ЂResultsї нажмите на ЂFitted 3D function & observed valsї. Ќа рисунке 2.2 представлен график зависимости (поверхность отклика) показател€ качества Y от факторов ’1 и ’2. |
| –исунок 2.2 |
ƒл€ получени€ двухмерного сечени€ имеющейс€ поверхности отклика необходимо установить курсор в чистой зоне окна-графика ЂModelї и щелкнуть левой клавишей мышки два раза. ¬ по€вившемс€ окне (рисунок 2.3), пользу€сь полосой прокрутки в поле ЂGraph typeї, выберите ЂContour plotї и нажмите ЂOKї. ѕолученный в результате график, представленный на рисунке 2.4, и есть двухмерное сечение поверхности отклика исследуемого показател€ качества Y.
≈сли качество исследуемого процесса, соединени€ и т.п. оцениваетс€ несколькими критери€ми оптимизации (показател€ми качества Y1, Y2 и т.д.), то дл€ отыскани€ области оптимума необходимо решение компромиссной задачи, которое основано на использовании графического способа. Ётот способ заключаетс€ в совмещении двухмерных сечений поверхностей отклика различных критериев оптимизации (показателей качества) дл€ одного объекта исследований и визуальном выборе оптимальных условий проведени€ эксперимента.

| —овмещение (накладывание друг на друга) сечений поверхностей отклика различных критериев оптимизации можно производить с помощью стандартной программы ЂPaintї. ƒл€ этого необходимо поочередно скопировать полученные сечени€ поверхностей отклика критериев оптимизации и вставить в файл программы ЂPaintї, редактиру€ рисунки и совмеща€ оси ’1 и ’2 (на панели с набором инструментов при этом должен быть установлен режим прозрачного фона). | |||
| –исунок 2.3 | ||||
| ќпределение регрессионной двухфакторной модели второго пор€дка. ¬ раздел ЂBasic Statistics/Tablesї вводим расчетную матрицу полного факторного эксперимента (например, трехуровневого двухфакторного эксперимента Ц 23). ƒл€ этого используем наиболее известную матрицу оно, имеющую хорошие статистические характеристики и | 
| |||
| –исунок 2.4 | ||||

| включающую небольшое число опытов. ѕример расчетной матрицы трехуровневого двухфакторного эксперимента представлен на рисунке 4.5. ћодель второго пор€дка дл€ двухфакторного эксперимента имеет следующий вид: | |||
| –исунок 2.5 | ||||
|
|
|
y=a0+a1*x1+a2*x2+a12*x1*x2+а11*х1*х1+а22*х2*х2.
ƒл€ получени€ окончательного вида уравнени€ необходимо исключить незначимые коэффициенты. ≈сли незначимых коэффициентов будет несколько, то необходимо их удал€ть последовательно по одному, начина€ с того, p-level-уровень которого наибольший, и каждый раз заново пересчитывать, пока не останутс€ только значимые.
Microsoft Excel
“абличный процессор MS Excel позвол€ет:
Ј –ешать математические задачи: выполн€ть разнообразные табличные вычислени€, вычисл€ть значени€ функций, строить графики и диаграммы и т.п.
Ј ќсуществл€ть численное исследование („то будет, если? ак сделать, чтобы?).
Ј ѕроводить статистический анализ.
Ј –еализовать функции базы данных - ввод, поиск, сортировку, фильтрацию (отбор) и анализ данных.
Ј ”станавливать защиту на отдельные фрагменты таблицы, делать их невидимыми.
Ј Ќагл€дно представл€ть данные в виде диаграмм и графиков.
Ј ¬водить и редактировать тексты.
Ј ќсуществл€ть обмен данными с другими программами, например, вставл€ть текст, рисунки, таблицы, подготовленные в других приложени€х.
Ј ќсуществл€ть многотабличные св€зи [4,5].
¬ Microsoft Excel примен€ютс€ различные функции: совместимости, кубов, дл€ работы с базами данных, даты и времени, инженерные функции, финансовые функции, информационные функции, логические функции, функции ссылки и поиска, математические и тригонометрические функции, статистические функции, текстовые функции, пользовательские функции, устанавливаемые вместе с надстройками.[4]
Microsoft Excel использовала дл€ выполнени€ априорного ранжировани€ и построени€ диаграмм значимости факторов.
јприорное ранжирование Ц это психологический эксперимент, основанный на обобщении независимых субъективных мнений экспертов [6-8]. Ёксперты Ц специалисты со стажем научной или практической работы, их количество рассчитываетс€ по формуле, но должно быть не менее 7Ц10 чел. ÷ель ранжировани€ Ц установление значимости факторов и сокращение их числа за счЄт отсева незначимых.
Ёкспертный опрос проводитс€ в несколько этапов:
1) подготовительный (постановка задачи, подготовка анкет);
2) проведение опроса, заполнение анкет;
3) обработка анкет;
4) проверка адекватности матриц;
5) проверка согласованности мнений экспертов;
6) построение гистограммы рангов.
анкетам предъ€вл€етс€ р€д требований:
Х дл€ каждого эксперта оформл€етс€ на отдельной странице;
Х должны включать максимум встречающихс€ факторов;
Х расположение факторов в предлагаемом перечне Ц хаотично;
Х по€снени€ должны быть чЄткими, особенно это касаетс€
назначени€ рангов (1 Ц наиболее значимый, или наоборот);
Х анкета должна быть простой по форме, например: ________________________________________________________
јнкета дл€ экспертного опроса специалистов по теме:
Ђѕоказатели оценки качество клеевых пакетов переда мужских пиджаковї
| є п/п | ќбозначение показател€ | Ќаименование показател€ | –анг показател€ |
| 1 | ’1 | ∆Єсткость при изгибе | |
| 2 | ’2 | ”садка от дублировани€ | |
| 3 | ’3 | ѕрочность на расслаивание | |
| 4 | ’4 | ‘ормоустойчивость | |
| 5 | ’5 | —тойкость к химчистке | |
| 6 | ’6 | ¬оздухопроницаемость | |
| 7 | ’7 | —тойкость к истиранию |
ѕосле обработки анкет составл€етс€ первоначальна€ матрица рангов (таблица 3.1).
|
|
|
“аблица 3.1 Ц ѕервоначальна€ матрица рангов
| є эксперта, m j | –анги по показател€м, Ki | —умма рангов | ||||||
| ’1 | ’2 | ’3 | ’4 | ’5 | ’6 | ’7 | ||
| Σ аij | ||||||||
| Qj (1) |
ѕри наличии Ђсв€занных ранговї рассчитываетс€ переформированна€ матрица рангов (таблица 3.2).
“аблица 3.2 Ц ѕереформированна€ матрица рангов
| є эксперта, m j | –анги по показател€м, Ki | Σ рангов | “j | ||||||
| ’1 | ’2 | ’3 | ’4 | ’5 | ’6 | ’7 | |||
| 3,5 | 3,5 | 6,5 | 6,5 | ||||||
| 3,5 | 3,5 | 1,5 | 1,5 | ||||||
| 3,5 | 3,5 | 0,5 | |||||||
| 3,5 | 3,5 | 0,5 | |||||||
| 1,5 | 1,5 | 3,5 | 3,5 | ||||||
| 5,5 | 3,5 | 3,5 | 5,5 | ||||||
| 5,5 | 3,5 | 3,5 | 5,5 | ||||||
| 1,5 | 4,5 | 1,5 | 4,5 | ||||||
| 3,5 | 3,5 | 6,5 | 6,5 | ||||||
| Σ аij | 17,5 | 16,5 | 37,5 | 34,5 | |||||
| Qj (2) | |||||||||
| ∆j | 22,5 | -5 | 23,5 | 2,5 | 5,5 | -20 | -29 | ||
| ∆2j | 506,25 | 552,25 | 6,25 | 30,25 |
ќбработка переформированной матрицы состоит в следующем [6 Ц 9]:
Ј расчЄт суммы рангов по каждому эксперту и по каждому показателю (суммы рангов по вертикали и горизонтали должны совпадать);
Ј расчЄт поправки на Ђсв€занные рангиї по формуле
 ,
,
где ti Ц число одинаковых рангов в i- й группе показателей;
u Ц число групп Ђсв€занных ранговї;
Ј определение места каждого показател€ θj;
Ј расчет средней суммы рангов (отношение суммы рангов к количеству показателей);
Ј расчет отклонени€ суммы рангов по каждому показателю от средней суммы рангов 
 i;
i;
Ј расчЄт квадрата отклонений  i 2 по каждому показателю.
Ќапример, дл€ эксперта є 1 
јдекватность первоначальной и переформированной матриц провер€етс€ по критерию ранговой коррел€ции —пирмена:
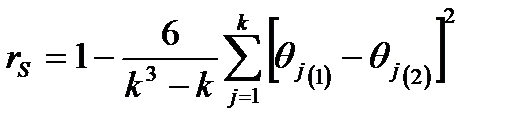 ,
,
где k Ц число показателей.
ѕри rs = 1 ранжировки полностью совпадают,
при rs = Ц1 Ц полностью противоположны,
при r s = 0 между ними нет никакого соответстви€,
при значени€х 0 < rs < 1 необходимо проверить значимость.
¬ примере
 .
.  = 0,89. —татистическую значимость критери€ ранговой коррел€ции —пирмена оценивают по критерию —тьюдента, наблюдаемое значение которого определ€етс€ по формуле
 .
.
ритерий —пирмена считаетс€ значимым, если расчЄтное значение критери€ —тьюдента не превышает табличное
ѕоскольку в примере критерий —пирмена  , т.е. близок к 1, то его статистическую значимость по критерию —тьюдента t провер€ть не нужно. јдекватность матриц очевидна.
√ипотезу о наличии согласи€ экспертов провер€ют с помощью коэффициента конкордации ендэла:
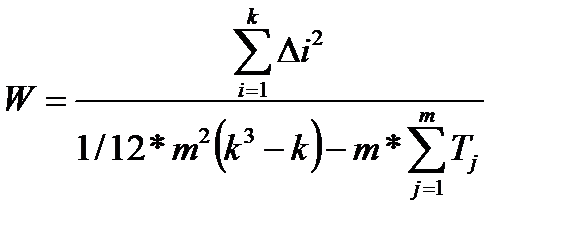 ,
,
где m Цчисло экспертов.ѕри W = 1,0 Ц согласие полное, при W < 0,37 Ц отсутствует, при W  0,375 Ц необходимо проверить его значимость.
|
|
|
«начимость коэффициента конкордации оценивают по критерию ѕирсона:
 .
.
ѕри  гипотеза о наличии согласи€ мнений экспертов принимаетс€.–асчЄтное значение критери€ ѕирсона значительно превышает табличное (12,59), поэтому согласие экспертов подтверждаетс€.
јнализ результатов экспертного опроса провод€т с помощью гистограмм Ц столбчатых диаграмм. ƒл€ традиционного воспри€ти€ Ђчем выше, тем лучшеї вертикальную ось в гистограмме рангов направл€ют сверху вниз, чтобы наиболее значимые факторы (сумма рангов которых минимальна) были графически выше незначимых. Ќа рисунке 3.1 представлена матрица рангов и диаграмма выполненна€ в Microsoft Excel
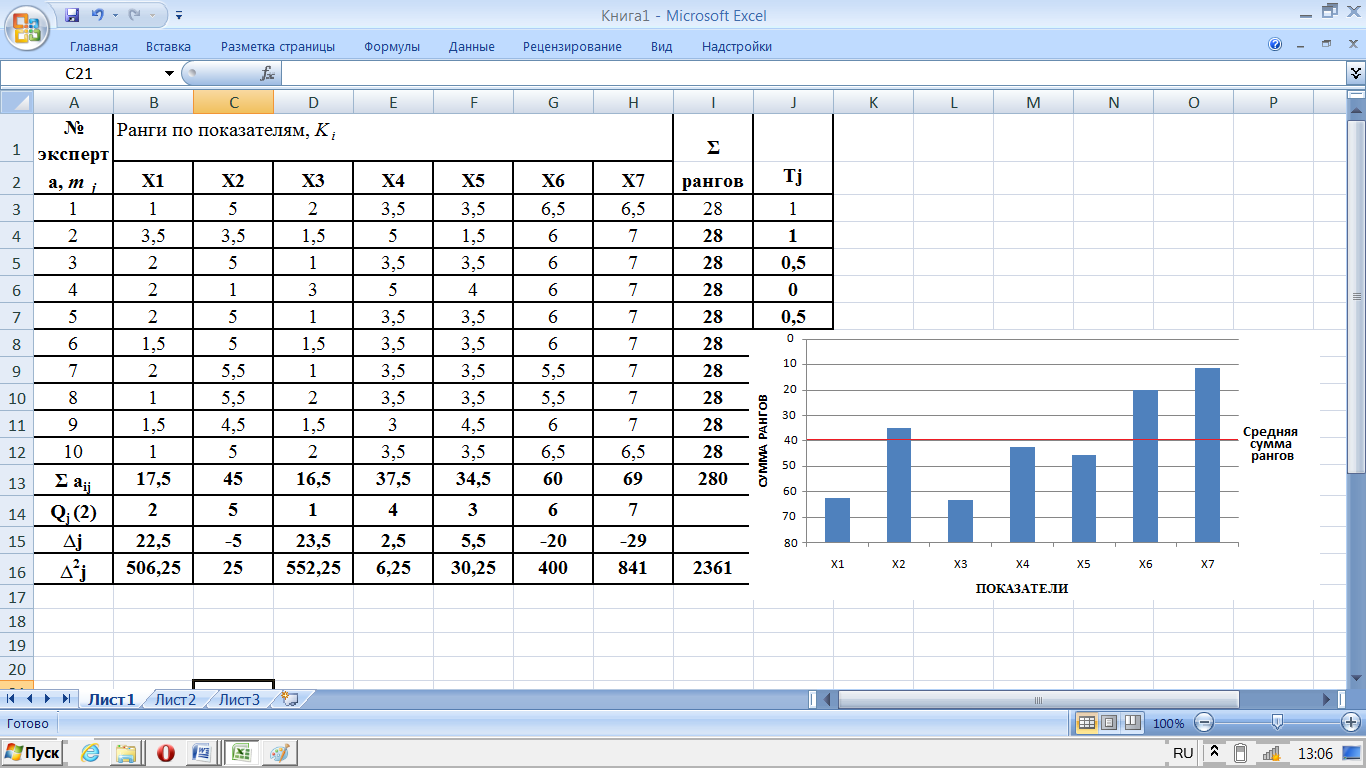
–исунок 3.1
ѕо гистограмме рангов делаютс€ следующие выводы:
Х факторы с суммой рангов выше линии средней суммы рангов €вл€ютс€ значимыми;
Х факторы с суммой рангов ниже линии средней суммы рангов
€вл€ютс€ незначимыми, ими можно пренебречь;
Х самый значимый фактор (с наименьшей суммой рангов)
€вл€етс€ основным в будущем эксперименте.
Maple.
Maple - программный пакет, система компьютерной алгебры. —оздана в компании Waterloo Maple Inc., котора€ основана в 1984 году и выпускает и продвигает на рынке р€д программных продуктов, ориентированных на сложные математические вычислени€, визуализацию данных и моделирование. —истема Maple предназначена дл€ символьных вычислений, хот€ имеет р€д средств и дл€ численного решени€ дифференциальных уравнений и нахождени€ интегралов. ќбладает развитыми графическими средствами. »меет собственный €зык программировани€ [10].
«адачи, наиболее часто встречаемые при экономико-математическом моделировании:
Ј ћатрицы.
Ј ƒифференциальное исчисление.
Ј »нтегрирование.
Ј –ешение задач линейного программировани€ с помощью программы Maple.
Ј ѕримеры решени€ транспортных задач в Maple.
Ќесомненными плюсами использовани€ Maple €вл€ютс€:
Ј «начительное сокращение затрат времени на поиск решени€ задач.
Ј ќбеспечение необходимой нагл€дности информации.
Ј ¬озможность быстрой корректировки введенных данных.
Ј —нижение возможности совершить ошибку в решении задач.
Ј ѕосто€нное обновление и программного обеспечени€.
¬ дальнейшем развитее программного обсечени€ приведЄт к тому, что математические пакеты программ будут использоватьс€ не только дл€ выполнени€ отдельных, наиболее трудоемких операций обработки данных, но и на всех этапах решени€ задач по Ёћћ [11].
—татистические функции
ѕакет stats представлен всего двум€ многоцелевыми статистическими функци€ми:
stats[subpackage, functionj(args) и subpackage[function](args)
ќднако благодар€ специальной форме задани€ параметров (в частности, в виде подпакетов Ч subpackages) возможно вычисление самых разнообразных статистических функций. »меютс€ следующие подпакеты:
anova Ч вариационный анализ; describe Ч функции распределени€ веро€тности; fit Ч регрессионный анализ; random Ч генераци€ случайных чисел с различными законами распределени€; statevalf Ч вычисление статистических функций и получение оценок дл€ массивов данных; statplots Ч построение графиков статистических функций; transform Ч функции преобразовани€ данных.
—татистический пакет stats имеет свою небольшую библиотечку дл€ построени€ графиков. ќна вызываетс€ в следующем виде: stats[statplots, function](args) или statplots[function](args). ¬ид графика задаетс€ описанием function: boxplot, histogram, notehedbox, quantile, quantile2, scatterld, scatter2d и symmetry. ƒанные функции обеспечивают построение типовых графиков, иллюстрирующих статистические расчеты.
ƒл€ визуализации вычислений используетс€ построение гистограмм. ƒл€ их создани€ пакет stats имеет функцию histogram: stats[statplotsбhistogram](data): или statplots[h1stogram](data)илиstats[statplots,histogram[scale](data) или statp1ots [histogram[scale](data). «десь data - список данных, scale Ч число или описатель.
|
|
|
ƒл€ проведени€ регрессионного анализа служит функци€ fit, котора€ вызываетс€ следующим образом: stats[fit,leastsquare[vars,eqn.parms]](data) или fit[leastsquare[vars,eqn.parms]](data), где data Ч список данных, vars Ч список переменных дл€ представлени€ данных, eqn Ч уравнение, задающее аппроксимирующую зависимость (по умолчанию линейную), parms Ч множество параметров, которые будут заменены вычисленными значени€ми. ‘ункци€ fit неприменима дл€ нелинейной регрессии. ѕри попытке ее проведени€ возвращаетс€ структура процедуры, но не результат регрессии.
—јѕ–
—истема автоматизации проектных работ (—јѕ–) или CAD - программный пакет, предназначенный дл€ проектировани€ (разработки) объектов производства (или строительства), а также оформлени€ конструкторской и/или технологической документации. ¬ыдел€ют следующие виды обеспечени€:
-математическое обеспечение —јѕ– Ч математические модели, методики и способы их получени€;
-лингвистическое обеспечение —јѕ–;
-техническое обеспечение —јѕ– Ч устройства ввода, обработки и вывода данных, средства поддержки архива проектных решений, устройства передачи данных;
-информационное обеспечение —јѕ– Ч информационна€ база —јѕ–, автоматизированные банки данных, системы управлени€ базами данных (—”Ѕƒ);
-программное обеспечение —јѕ–;
-программные компоненты —јѕ– (примером может служить √еометрический решатель —јѕ–);
-методическое обеспечение;
-организационное обеспечение.
—јѕ– используетс€ в работе конструкторов и технологов, св€занных с разработкой чертежей, схем, диаграмм, то есть с обработкой графических изображений.
ќпыт автоматизации проектных работ позволил установить, что автоматизаци€ целесообразна в тех отрасл€х народного хоз€йства, где быстрота смен€емости изготовл€емых моделей и изделий заставл€≠ет вести проектные работы в сжатые сроки. таким отрасл€м отно≠ситс€ и швейна€ промышленность. ¬ св€зи с расширением ассортимента выпускаемой продукции и по€влением новых материалов, оборудовани€, спецприспособлений становитс€ все более сложным выполнение всех проектных работ по подготовке производства новых моделей за счет простого увеличени€ числа инженеров. Ќеобходимо качественно изменить их труд, поручить средствам автоматизации основную массу выполн€емых работ.
¬ швейной промышленности зан€лись вопросами автоматизации проектировани€ значительно позже других отраслей (в середине 70-х годов), однако уже сегодн€ достигнуты значительные результаты. Ќа р€де швейных предпри€тий внедрены разработки по автоматизации конструкторской и технологической подготовки производства. —реди них следующие подсистемы:
Ј расчета и преобразований базовых конструкций одежды;
Ј получени€ конструкторской документации на новую модель
одежды, включа€ градацию лекал;
Ј проектировани€ технологических процессов изготовлени€ швейных изделий;
Ј расчета кусков материала;
Ј выполнени€ раскладок и нормировани€ расхода материалов и др.
¬се программные модули, вход€щие в промышленную —јѕ–, предусматривают работу на достаточно мощном миникомпьютере и на так называемых рабочих станци€х, действующих в определенной операционной среде. »спользуютс€ технические средства ввода и вывода графической информации.[12 ]
—ервер состоит из трех блоков (частей):
Х системного блока, включающего блок питани€, электронные схемы, накопители: (или дисководы) дл€ гибких магнитных дисков, накопитель на жестком магнитном диске (винчестер);
Х клавиатуры, позвол€ющей вводить символы в компьютер;
Х монитора (или диспле€) Ц дл€ изображени€ текстовой и графической информации.
системному блоку компьютера (серверу) могут быть подключены различные устройства ввода-вывода информации, которые €вл€ютс€ внешними. роме монитора и клавиатуры такими устройствами €вл€ютс€:
Х принтер формата ј4 Ц дл€ вывода на печать текстовой и графической информации;
Х мышь Ц устройство, облегчающее ввод информации в компьютер;
Х дигитайзер Ц устройство дл€ ввода графической информации;
Х плоттер Ц устройство дл€ вывода графической информации.
роме того, в системе автоматизированного проектировани€ используютс€ во внешнем исполнении такие устройства, как стример дл€ записи данных на магнитную ленту, и модем Ц дл€ обмена информацией с другими компьютерами через телефонную св€зь. Ќа рисунке 4.1 представлен дигитайзер.

–исунок 4.1
Ћекала закрепл€ютс€ на рабочей плоскости дигитайзера липкой лентой в произвольном пор€дке, но желательно учитывать ворс или направленный рисунок, если он имеетс€ (что бы конструктор не тратил врем€ на перевороты)
|
|
|
 Ќа рисунке 4.2 представлен внешний вид экрана диспле€ дл€ получени€ раскладок в модуле –ј— Ћјƒ ј (GERBER).
–исунок 4.2
—оздание —јѕ– характеризует новое научно-техническое направление в проектировании и определ€ет более высокий уровень применени€ вычислительной техники, чем только использование Ё¬ћ дл€ решени€ отдельных проектных задач. –азвитие систем автоматизированного проектировани€ приведет к созданию новых теорий и методов, учитывающих необходимость математического моделировани€ объектов проектировани€. »зменение организационно-технического уровн€ проектировани€, несомненно, приведет к улучшению качества продукции.
«аключение
ѕодвод€ итоги проведЄнной работе, можно сделать вывод о том, что применение информационных технологий в исследовани€х имеет большое значение. ƒанные технологии позвол€ют подн€ть исследовани€ в этих област€х на качественно новый уровень.
“акже в данной работе были рассмотрены практические примеры использовани€ информационных технологий. »з всего вышесказанного можно сделать вывод о необходимости широкого применени€ информационных технологий в научных исследовани€х [2].
Ћитература
1.»нформационные технологии в экономике [Ёлектронный ресурс]. Ц –ежим доступа: http://student.zoomru.ru/ekonom/informacionnye-tehnologii-v-jekonomike/176052.1479431.s4.html. - ƒата доступа: 23.12.2013.
2.»спользование информационных технологий в изучении истории Ѕелорусского √осударственного ”ниверситета - [Ёлектронный ресурс]. Ц –ежим доступа: http://rudocs.exdat.com/docs/index-98358.htm. - ƒата доступа: 23.12.2013.
3.ящерицын, ѕ. ». ѕланирование эксперимента в машиностроении / ѕ. ». ящерицын, ≈. ». ћахаринский. Ц ћинск: ¬ышэйша€ школа, 1985. Ц 285 с.
4. Microsoft Excel [Ёлектронный ресурс]. Ц –ежим доступа: http://ru.wikipedia.org/wiki/Microsoft_Excel. - ƒата доступа: 24.12.2013.
5. ¬озможности Microsoft Excel [Ёлектронный ресурс]. Ц –ежим доступа: http://otherreferats.allbest.ru/programming/00028176_0.html. - ƒата доступа: 24.12.2013.
6. “ихомиров, ¬. Ѕ. ѕланирование и анализ эксперимента / ¬. Ѕ. “ихомиров. Ц ћосква: ЋЄгка€ индустри€, 1974. Ц 262 с.
7. Ѕольшакова, ». . —войства прокладочных и прикладных материалов и комплектование их в пакетах верхней одежды / ». . Ѕольшакова, ќ. Ќ. алина, Ќ. ¬. ÷аценко // Ўвейна€ промышленность. ќбзорна€ информаци€. Ц 1989. Ц ¬ып.1. Ц 56 с.
8. √арска€, Ќ. ѕ. –азработка экспресс-метода оценки качества пакетов полочек мужской верхней одежды / Ќ. ѕ. √арска€, –. Ќ. ‘илимоненкова, ≈. ’. ћеликов // »звести€ ¬”«ов. “ехнологи€ лЄгкой промышленности. Ц 1991. Ц є1. Ц —. 68-71.
9. ќсновы научных исследований: конспект лекций дл€ студентов специальности 50 01 02 Ђ онструирование и технологи€ швейных изделийї дневной и заочной форм обучени€ / ”ќ Ђ¬√“”ї; сост. Ќ. ѕ. √арска€. Ц ¬итебск: ¬√“”, 2003. Ц 42 с.
10. Maple [Ёлектронный ресурс]. Ц –ежим доступа: http://ru.wikipedia.org/wiki/Maple. - ƒата доступа: 24.12.2013.
11. «адачи, решаемые Maple [Ёлектронный ресурс]. Ц –ежим доступа: http://otherreferats.allbest.ru/emodel/00109873_0.html. - ƒата доступа: 24.12.2013.
12. ороткова, ». ¬. ќбзор швейных —јѕ– (возникновение и развитие) / ». ¬. ороткова, —. ¬. ћелкова // Ўвейна€ промышленность. Ц 2002. Ц є5. Ц —.40-42.

