


ћатер≥альне виробництво розд≥лене на дв≥ галуз≥: енергетика ≥ машинобудуванн€.
«адан≥ матриц€ пр€мих витрат

≥ вектор к≥нцевого продукту
 .
.
¬изначити:
1. Ќеобх≥дний обс€г валового випуску кожноњ галуз≥.
2. ћ≥жгалузев≥ потоки.
–еал≥зац≥€ задач≥ в MathCAD:
| ќбчисленн€ | ѕо€сненн€ |

| ORIGIN Ц зумовлена константа, €ка задаЇ початкову нумерац≥ю елемент≥в вектора або матриц≥ (за умовчанн€м елементи нумеруютьс€ з 0). identity(n) Ц функц≥€, €ка задаЇ одиничну матрицю (n Ц розм≥р матриц≥). |

| Q Ц вектор валового продукту |

| i Ц ранжована зм≥нна, €ка набуваЇ значень 1, пот≥м 2 ≥ орган≥зовуЇ цикл≥чн≥ обчисленн€ по створенню матриц≥ ћ.
 - команда вид≥л€Ї i Ц ий стовпець матриц≥ в окремий вектор.
ћ - матриц≥, що м≥стить величини м≥жгалузевих поток≥в qi,j, ≥ обчислюютьс€ виход€чи з формули (2).
. - команда вид≥л€Ї i Ц ий стовпець матриц≥ в окремий вектор.
ћ - матриц≥, що м≥стить величини м≥жгалузевих поток≥в qi,j, ≥ обчислюютьс€ виход€чи з формули (2).
.
|
¬ар≥анти ≥ндив≥дуального «авданн€ є3
| є вар≥анту | ј | q |
| 1. | 
| 
|
| 2. | 
| 
|
| 3. | 
| 
|
| 4. | 
| 
|
| 5. | 
| 
|
| 6. | 
| 
|
| 7. | 
| 
|
| 8. | 
| 
|
| 9. | 
| 
|
| 10. | 
| 
|
| 11. | 
| 
|
| 12. | 
| 
|
| 13. |
|
|
| 14. |
|
|
| 15. |
|
|
| 16. |
|
|
| 17. |
|
|
| 18. |
|
|
| 19. |
|
|
| 20. |
|
|
IV.4. «авданн€ є 4.
“ема: ”хваленн€ оптимального р≥шенн€ в умовах визначеност≥.
оротк≥ теоретичн≥ в≥домост≥ дл€ виконанн€ «авданн€ є4
«адача ухваленн€ р≥шенн€ в умовах визначеност≥ зводитьс€ до знаходженн€ м≥н≥муму або максимуму ц≥льовоњ функц≥њ, €ка описуЇ досл≥джувану економ≥чну систему.
–озвТ€занн€ завдач оптим≥зац≥њ (завданн€ пошуку м≥н≥муму ≥ максимуму функц≥й одн≥Їњ або багатьох зм≥нних) Ц одна з найважлив≥ших сфер застосуванн€ математичних метод≥в. ¬ област≥ економ≥ки ≥снуЇ безл≥ч ситуац≥й, коли буваЇ потр≥бно знати максимум або м≥н≥мум функц≥њ.
–озгл€немо розв/€занн€ задач≥ одновим≥рноњ оптим≥зац≥њ.
«адана ц≥льова функц≥€ у = f(x). ƒе f(x) Ц нел≥н≥йна функц≥€. ѕотр≥бно визначити м≥н≥мальне (максимальне) значенн€ функц≥њ. ƒана задача маЇ р≥шенн€, €кщо функц≥€ f(x) обмежена знизу (зверху). ћетоди р≥шенн€ задач≥ припускають попереднЇ знаходженн€ точки м≥н≥муму (максимуму) х* функц≥њ, тобто точки, в €к≥й функц≥€ дос€гаЇ свого найменшого (найб≥льшого) значенн€. ћаксимальне (м≥н≥мальне) значенн€ функц≥њ у* знаходитьс€ €к: у* = f(х*). як правило, точки м≥н≥муму (максимуму) дл€ нел≥н≥йних функц≥й Ї ≥ррац≥ональними числами. “ому при њх знаходженн≥ необх≥дно задати точн≥сть знаходженн€ точки м≥н≥муму (максимуму) e (мале число, що визначаЇ, наск≥льки точне р≥шенн€ в≥др≥зн€тиметьс€ в≥д знайденого наближеного).
–озв€занн€ задач≥ проводитьс€ в два етапи:
- граф≥чний анал≥з функц≥њ f(x);
- знаходженн€ точки м≥н≥муму (максимуму).
ƒл€ граф≥чного анал≥зу потр≥бно побудувати граф≥к функц≥њ f(x) ≥ визначити чи маЇ завдача розвТ€зок. якщо маЇ, то визначити Ђгрубеї значенн€ точки м≥н≥муму (максимуму).
ƒл€ граф≥чного анал≥зу функц≥њ f(x) необх≥дна побудова граф≥ка функц≥њ.
|
|
|
ƒл€ побудови граф≥к≥в в систем≥ MathCad Ї граф≥чний процесор, €кий дозвол€Ї будувати найр≥зноман≥тн≥ш≥ граф≥ки (у декартов≥й систем≥, в пол€рн≥й систем≥ координат, тривим≥рн≥ граф≥ки ≥ так дал≥) ƒл€ побудови граф≥к≥в необх≥дно подати команду Insert ЃGraph (¬ставка Ѓ √раф≥к) або скористатис€ ѕанеллю ≥нструмент≥в √раф≥ки (Graph), €ка визиваЇтьс€ з панел≥ ћатематика кнопкою  ≥з зображенн€м граф≥ка.
ѕобудова двом≥рних граф≥к≥в в координатних ос€х X-Y. ожна точка в декартов≥й систем≥ характеризуЇтьс€ своњми координатами х ≥ y =f(x), де х абсциса точки, а y ордината. “очки з'Їднуютьс€ одна з одною р≥зноман≥тними л≥н≥€ми (суц≥льною, пунктирною ≥ так дал≥).
ƒл€ побудови граф≥к≥в в декартов≥й систем≥ координат MathCad передбачаЇ два способи побудови граф≥к≥в функц≥й одн≥Їњ зм≥нноњ у = f(x).
1. —прощений спос≥б без заданн€ значень ранжован≥й зм≥нн≥й х (границ≥ х задаютьс€ автоматично в≥д Ц10 до10);
ѕосл≥довн≥сть д≥й наступна:
1). ѕодати команду
InsertЃGraphЃX-Y Plot (¬ставкаЃ√раф≥кЃƒекартов≥ координати) з меню
або кнопкою з панел≥
 .
.
«'€витьс€ шаблон двом≥рного граф≥ка ≥з заповнювачами:

|
¬ област≥ розм≥щенн€ граф≥ка знаход€тьс€ заповнювач≥, у вигл€д≥ темних маленьких пр€мокутник≥в n, розташованих б≥л€ осей абсцис ≥ ординат майбутнього граф≥ка.
2). ” заповнювач≥ необх≥дно ввести вирази, задаюч≥ координати точок граф≥ка, тобто б≥л€ ос≥ 0Y вираз, що в≥дпов≥даЇ функц≥њ х2 + 3х - 2, а б≥л€ ос≥ 0X ≥мТ€ аргументу х:

|
3). ѕ≥сл€ цього клацнути за межами граф≥чноњ област≥. —истема автоматично розм≥стить границ≥ дл€ аргументу (-10; 10) та границ≥ зм≥ни значень функц≥њ ≥ побудуЇ граф≥к:

|
4). «вичайний спос≥б ≥з заданн€м ранжован≥й зм≥нн≥й х множини значень.
якщо граф≥к функц≥њ необх≥дно побудувати в задан≥й област≥ значень х, тод≥ попередньо потр≥бно задати необх≥дн≥ значенн€ дл€ х, описавши њњ €к ранжовану.

|

|
‘орматуванн€ граф≥ка. ƒл€ того, щоб в≥дформатувати граф≥к, його потр≥бно вид≥лити (клацнути по граф≥чн≥й област≥) ≥ подати команду:
Format Ѓ Graph Ѓ X-Y Plot,
або дв≥ч≥ клацнути по граф≥ку. «'€витьс€ д≥алогове в≥кно, в €кому 4 вкладки:
1). ¬кладка X-Y Axes (X-Y ос≥) задаЇ характер в≥дображенн€ осей.

| Log Scale(Ћогарифм≥чна шкала) - установка логарифм≥чного масштабу. Crid Lines(ƒопом≥жн≥ л≥н≥њ) Ц установка л≥н≥й масштабноњ с≥тки Numbered (Ќумерац≥€) - установка цифрових даних по ос€х. Autoscale (јвтомасштаб) Цавтоматичне масштабуванн€ граф≥ка. Show Markers (ѕоказати м≥тки) Цустановка д≥лень по ос€х. |
| Auto Grid (јвтос≥тка) Цавтоматична установка масштабних л≥н≥й. Number of Grid (–азме с≥тки) Цустановка заданого числа масштабних л≥н≥й. √рупа Axes Style (—тиль осей) дозвол€Ї задати стиль в≥дображенн€ осей: ú Boxed (ќбмежена область) - ос≥ у вигл€д≥ пр€мокутника; ú Crossed (ѕеретин осей); ú None (Ѕез меж) Цв≥дсутн≥сть осей; ú Equal Scales (–≥вн≥ масштаби) Ц установка однакового масштабу по ос€х граф≥ка. |
2). ¬кладка Traces (—л≥д) Ц дл€ управл≥нн€ в≥дображенн€м побудованих л≥н≥й. ожна крива зображаЇтьс€ своњм кольором (€кщо на граф≥ц≥ дек≥лька кривих). ѕоточний формат кожноњ л≥н≥њ приведений в списку, а п≥д списком розташован≥ елементи управл≥нн€, що дозвол€ють зм≥нювати формат.
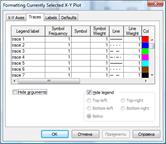
| Symbol (—имвол) Цдозвол€Ї вибрати маркери дл€ окремих точок. Line (Ћ≥н≥€) ЦзадаЇ тип л≥н≥њ. Color ( ол≥р) Цустановка кольору л≥н≥й ≥ базових точок. Type (“ип) Цустановка типу √раф≥ка. Weight (¬ага) Цустановка товщини л≥н≥й. Hide Arguments (ѕриховати јргументи) Цустановка цього прапорц€ дозвол€Ї приховати позначенн€ математичних вираз≥в по ос€х граф≥ка. Hide Legend (ѕриховати легенду) -установка цього прапорц€ дозвол€Ї приховати ≥мена кривих граф≥ка. | |
3).. ¬кладка Label (Ќаписи) дозвол€Ї вводити написи заголовка, написи по ос€х X ≥ Y.
|
|
|

4). ¬кладка Defaults («а умовчанн€м) дозвол€Ї вводити написи.

| якщо клацнути по кнопц≥ Change to Defaults(«м≥нити за умовчанн€м) ц≥й кнопц≥, то можна повернути вс≥ стандартн≥ параметри в≥дображенн€ граф≥в функц≥њ одн≥Їњ зм≥нноњ. ¬становивши прапорець Use for Defaults(¬икористовувати дл€ умовчанн€)Цдозвол€Ї призначен≥ встановлен≥ на ≥нших вкладках параметри форматуванн€ параметрами за умовчанн€м. |
ѕриклад розв€занн€ задач≥ одном≥рноњ оптим≥зац≥њ. «адан≥ функц≥€ у(х)= ех-1 + х2 ≥ точн≥сть обчислень e = 0,0001. «найти м≥н≥мальне значенн€ функц≥њ.
ѕроведемо граф≥чний анал≥з функц≥њ.

« граф≥ка визначаЇмо, що Ђгрубеї значенн€ точки м≥н≥муму дор≥внюЇ 0.
”точнимо знайдене значенн€:

онстанта TOL задаЇ точн≥сть обчислень. ”точнене значенн€ точки м≥н≥муму р≥вне -0,1572.
ќбчислюЇмо м≥н≥мальне значенн€ функц≥њ:

ћ≥н≥мальне значенн€ функц≥њ уmin = 0,3391.
ƒл€ уточненн€ точки м≥н≥муму застосовувалась стандартна функц≥€ minimize.
якщо необх≥дно уточнити точку максимуму, то застосовуЇтьс€ функц≥€ maximize.
”мова «авданн€ є4
¬≥домо, що ф≥рма-монопол≥ст характеризуЇтьс€ кривою загальних витрат виду:
C(q) = c+dq-eq2+fq3.
(q - ц≥на одиниц≥ продукц≥њ).
ћетою повед≥нки ф≥рми в короткостроковому пер≥од≥ Ї максим≥зац≥€ прибутку. «наючи функц≥ю попиту на товар ф≥рми:
p(q) = a-bq,
визначити:
1) оптимальний обс€г монопольного випуску продукц≥њ;
2) оптимальну ц≥ну збуту продукц≥њ;
3) величину максимального прибутку.

