


ѕоложение каждой точки в трехмерном пространстве, как известно, задаетс€ трем€ координатами (в частности, в декартовой системе координат они традиционно обозначаютс€  ). Ќабор точек, принадлежащий некоторой линии в пространстве, задаетс€ в виде трех векторов, которые содержат координаты точек по соответствующим координатным ос€м. »мена данных векторов указываютс€ в списке формальных параметров функции plot3, котора€ выполн€ет проектирование соответствующей трехмерной линии на плоскость и строит соответствующее (результирующее) изображение. —ледует подчеркнуть, что все сопутствующие вычислени€ и выбор необходимых параметров визуализации (пределы изменени€ переменных по ос€м координат, число графических и числовых меток, выбор цвета линии, цвета фона и т.д.) отображаемой зависимости будут сделаны автоматически в соответствии с общей концепцией высокоуровневой графики системы MATLAB.
“ак, например, дл€ построени€ пространственной (винтовой) спирали ( ,
,  ,
,  ) необходимо выполнить следующую последовательность команд (рис. 2.12.1):
>> t=0:pi/100:10*pi;
>> x=cos(t);
>> y=sin(t);
>> plot3(x,y,t);
>> grid on
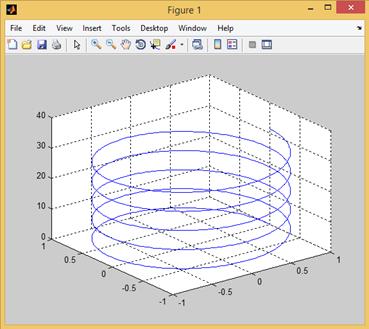
–ис. 2.12.1. ѕример построени€ пространственной кривой.
—ледует по€снить, что в результате задани€ функции
plot3(x,y,t)
система MATLAB построит трехмерную линию, координаты которой соответствуют элементам векторов x, y, и t.
‘ункци€ plot3, также как и функци€ plot, принимает дополнительный аргумент, задающий параметры графической линии (такие как цвет, тип линии и тип маркера, помечающего точки на графике). “ак, например, дл€ того, чтобы изобразить показанную на рис. 2.12.1 спираль в виде зеленой пунктирной линии, необходимо ввести следующую команду:
plot3(x,y,t,Тg:Т)
‘ункцию plot3, €вл€ющуюс€ трехмерным аналогом функции plot, можно примен€ть и дл€ отображени€ поверхностей. ¬ таком случае в отличие от представленного примера, в списке формальных параметров указываютс€ три матрицы одинакового размера. ƒалее высокоуровнева€ графическа€ подсистема MATLAB автоматически выполн€ет трехмерную визуализацию поверхности (набора линий в пространстве, количество которых будет соответствовать числу столбцов матриц) без сколь-либо существенных усилий со стороны пользовател€.
–ассмотрим более подробно задание указанных матриц, используемых при визуализации поверхности. ѕусть в точке с координатами  вычислено значение функции
  . ƒл€ всех таких точек
  имеем соответствующие массивы точек. —оответствующие функции системы MATLAB провод€т через эти точки гладкую поверхность и отображают ее проекцию на экран монитора компьютера. —ледует отметить, что наиболее часто дл€ вычислени€ аргументов используетс€ разбиение области определени€ функции в виде пр€моугольной сетки.
ƒл€ описани€ такой сетке в MATLAB необходимо создать две матрицы, которые будем обозначать здесь X и Y. „исло строк данных матриц равно количеству узлов разбиени€ отрезка  , а число столбцов Ц количеству узлов разбиени€ отрезка
  , при этом строки матрицы X одинаковые и содержат координаты узлов разбиени€ отрезка
  , а столбцы матрицы Y также одинаковые и содержат координаты узлов разбиени€ отрезка
  . ƒл€ формировани€ таких матриц используетс€ функци€ meshgrid, имеюща€ следующий синтаксис:
|
|
|
[X Y]=meshgrid(x,y)
где x и y Ц векторы, содержащие координаты узлов сетки (табличных точек) вдоль координат  и
и  соответственно.
«аметим, что в частном случае, когда область определени€ функции представл€ет собой квадратную сетку т.е.  , то к функции meshgrid можно обратитьс€ с одним аргументом:
[X Y]=meshgrid(x)
¬ дальнейшем в каждом узле полученной таким образом пр€моугольной сетки вычисл€ютс€ значени€ функции  и сохран€ютс€ в соответствующей матрице Z.
ќчевидный проигрыш в пам€ти из-за повтор€ющихс€ строк в массиве X и повтор€ющихс€ столбцов в массиве Y компенсируютс€ простотой и эффективностью вычислени€ значений визуализируемой функции в узлах сетки. “акой подход естественным образом гарантирует правильность сочетани€ координат x и y в узлах сетки.
ƒл€ построени€ поверхности в виде линий, получаемых в сечении поверхности плоскост€ми, параллельными плоскости  , как и в предыдущем примере используетс€ функци€ plot3(X,Y,Z).
ѕостроение поверхностей.
ѕомимо этой простейшей команды система MATLAB располагает еще р€дом функций, позвол€ющих добиватьс€ большей реалистичности при визуализации трехмерных графиков. Ёто, в частности, функции mesh (примен€етс€ дл€ построени€ каркасной поверхности (или иначе проволочного каркаса (wire frame)), который образуетс€ путем соединени€ точек поверхности с ближайшими сосед€ми отрезками пр€мых), surf (примен€етс€ дл€ построени€ каркасной поверхности, кажда€ клетка которой закрашиваетс€ определенным цветом, что позвол€ет значительно улучшить воспри€тие поверхности) и surfl, порождающие графические объекты типа surface. ажда€ така€ функци€ допускает множество разных вариантов вызова, отличающихс€ наборами входных параметров, и возвращает указатель на созданный объект.
–ассмотрим в качестве важного характерного примера задачу отображени€ функции  при
при  и
и  . ƒл€ ее решени€ воспользуемс€ последовательно функци€ми plot3, mesh, surf и surfl (соответствующие результаты представлены на рис. 2.12.2-2.12.5):
>> x=-2:0.1:2;
>> y=-1:0.1:1;
>> [X,Y]=meshgrid(x,y);
>> Z=exp(-X.^2-Y.^2);
>> plot3(X,Y,Z);
>> hmesh=mesh(X,Y,Z)
>> figure
>> mesh(X,Y,Z);
>> figure
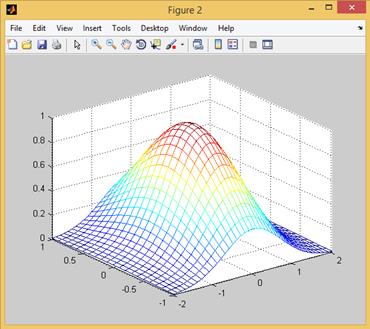
>> surf(X,Y,Z);
>> figure
>> surfl(X,Y,Z);
ак видно из текста представленной программы, дескриптор объекта surface, возвращенный функцией mesh, был занесен в переменную hmesh. ƒл€ получени€ информации о типе графического объекта может быть использована команда get:
>> get(hmesh,'Type')
ans =
surface
ѕо€сним, что разные ребра дл€ лучшего воспри€ти€ Ђобъемности изображени€ї автоматически окрашиваютс€ в разные цвета. Ёти цвета соответствуют значени€м функции (по умолчанию более высоким (большим по величине) значени€м функции соответствуют оттенки красного цвета, а более низким (меньшим по величине) Ц синего). ¬ общем случае действует следующий алгоритм выбора цвета дл€ вершин, ребер и граней поверхности. ¬се отображаемые элементы упор€дочиваютс€ по возрастанию координаты z характерной точки (дл€ вершины Ц это таблична€ точка, дл€ ребра Ц аппликата середины, дл€ грани Ц аппликата точки пересечени€ диагоналей). «атем им присваиваютс€ так называемые индексы цвета (одинаковым значени€м z присваиваетс€ один и тот же индекс) и по этом индексу выбираютс€ компоненты цвета из массива colormap, установленного в данный момент графического окна (объект типа Figure). ≈сли пользовател€ не уст-
|
|
|
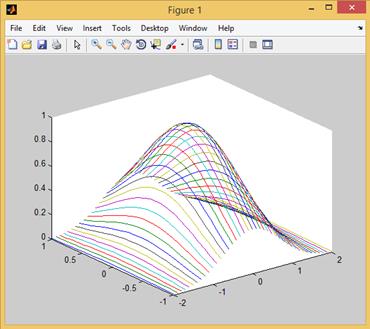
–ис. 2.12.2. ¬изуализаци€ поверхности с использованием функции plot3.
–ис. 2.12.3. ¬изуализаци€ поверхности с использованием функции mesh.
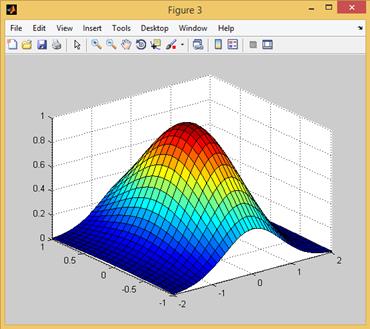
–ис. 2.12.4. ¬изуализаци€ поверхности с использованием функции surf.
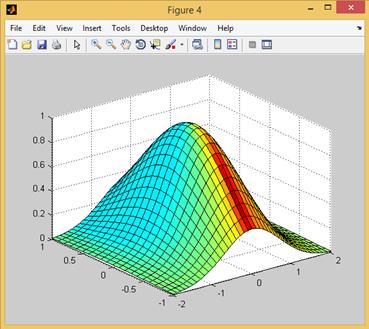
–ис. 2.12.5. ¬изуализаци€ поверхности с использованием функции surfl.
раивает выбор цвета по высоте аппликаты, при создании поверхности можно в список аргументов добавить еще один массив той же размерности, что и X, Y, Z, который сформирует свойства CData и изменит способ окраски элементов поверхности.
ѕри использовании функций mesh, surf и surfl, в отличие от функции plot3, осуществл€етс€ удаление невидимых линий поверхности. ѕри необходимости отобразить невидимые ребра (сделать отображаемую поверхность Ђпрозрачнойї) следует выполнить команду
>> hidden off
¬озможно, что при отображении очень простых фигур типа пирамид или параллелепипедов невидимые линии могут оказатьс€ полезными, однако на насыщенном изображении их присутствие лишь затрудн€ет воспри€тие. ƒл€ выключени€ режима отображени€ невидимых ребер (отмены режима Ђпрозрачности) необходимо выполнить команду
>> hidden on
ѕри использовании функции surf линии (ребра между гран€ми) поверхности отображаютс€ черным цветом, а цвет каждой клетки зависит от значени€ функции (высоты) в некоторой характерной точке этой клетки.
— помощью команды shading способ закраски может быть изменен. ƒанна€ команда допускает использование следующих трех режимов:
flat Ц отображение линий поверхности (ребер) скрыто;
interp Ц отображение линий поверхности скрыто (создаетс€ видимость сплошной поверхности), цвета между соседними элементами поверхности сглажены;
faceted Ц возвращение к виду поверхности, заданному по умолчанию.
“аким образом у пользовател€ имеетс€ возможность отобразить каждый участок поверхности, ограниченный четырьм€ точками, своим цветом и отобразить между ними черные ребра (если иное не задано в свойствах объекта при вызове функции surf).
≈сли к имени функции mesh добавить букву c, то можно построить каркасную поверхность с лини€ми уровн€ функции, спроектированными на плоскость  . ѕри использовании функции meshc дл€ решени€ задачи из предыдущего примера будем иметь (рис. 2.12.6):
>> x=-2:0.1:2;
>> y=-1:0.1:1;
>> [X,Y]=meshgrid(x,y);
>> Z=exp(-X.^2-Y.^2);
>> meshc(X,Y,Z);
>> axis square;
ѕо€сним, что команда (функци€) axis square, задающа€ одинаковые размеры вдоль соответствующих осей координат (рис. 2.12.6).
јналогично, если вместо функции surf применить функцию surfc, то можно построить закрашенную поверхность с лини€ми уровн€, спроектированными на плоскость (рис. 2.12.7).

–ис. 2.12.6. ¬изуализаци€ поверхности с использованием функции meshc.

–ис. 2.12.7. ¬изуализаци€ поверхности с использованием функции surf.
>> x=-2:0.1:2;
>> y=-1:0.1:1;
>> [X,Y]=meshgrid(x,y);
>> Z=exp(-X.^2-Y.^2);
>> surfc(X,Y,Z);
«адание дополнительных параметров трехмерных графиков.
«аметим, что среди многочисленных параметров функций, создающих и отображающих поверхности, могут присутствовать пары типа
('—войство', значение)
инициализирующие значени€ соответствующих свойств. “ак, например, можно непосредственно изменить свойство EdgeColor построенного объекта типа surface, использу€ команду shading interp:
>> set(hmesh,'FaceColor','interp')
–азумеетс€, можно получить информацию о всех свойствах графического объекта типа surface:
>> hmesh=mesh(X,Y,Z)
hmesh =
174.0062
>> get(hmesh)
AlphaData: 1
AlphaDataMapping: 'scaled'
Annotation: [1x1 hg.Annotation]
|
|
|
CData: [21x41 double]
CDataMapping: 'scaled'
DisplayName: ''
EdgeAlpha: 1
EdgeColor: 'flat'
FaceAlpha: 1
FaceColor: [1 1 1]
LineStyle: '-'
LineWidth: 0.5000
Marker: 'none'
MarkerEdgeColor: 'auto'
MarkerFaceColor: 'none'
MarkerSize: 6
MeshStyle: 'both'
XData: [21x41 double]
YData: [21x41 double]
ZData: [21x41 double]
FaceLighting: 'none'
EdgeLighting: 'flat'
BackFaceLighting: 'reverselit'
AmbientStrength: 0.3000
DiffuseStrength: 0.6000
SpecularStrength: 0.9000
SpecularExponent: 10
SpecularColorReflectance: 1
VertexNormals: [21x41x3 double]
NormalMode: 'auto'
BeingDeleted: 'off'
ButtonDownFcn: []
Children: [0x1 double]
Clipping: 'on'
CreateFcn: []
DeleteFcn: []
BusyAction: 'queue'
HandleVisibility: 'on'
HitTest: 'on'
Interruptible: 'on'
Selected: 'off'
SelectionHighlight: 'on'
Tag: ''
Type: 'surface'
UIContextMenu: []
UserData: []
Visible: 'on'
Parent: 173.0057
XDataMode: 'manual'
XDataSource: ''
YDataMode: 'manual'
YDataSource: ''
CDataMode: 'auto'
CDataSource: ''
ZDataSource: ''
ѕоверхность графика можно трактовать как материальную поверхность с определенными физическими свойствами по отражению света, которые следует задавать €вным образом. ¬виду того, что разные материалы, очевидно, по-разному отражают падающие лучи, можно подобрать некоторый материал, чтобы получить наилучшее (с точки зрени€ пользовател€) изображение. ¬ частности, использу€ функцию с аргументом copper
>> colormap(copper)
можно установить цвет поверхности, аналогичный цвету медной поверхности (copper Ц в переводе с английского €зыка Ђмедьї). ѕоследующее использование команд
>> surfl(X,Y,Z)
>> shading interp
позвол€ет получить вполне реалистично выгл€д€щий и нагл€дный график, представленный на рис. 2.12.8.
ѕо€сн€€ данный пример, перечислим ниже стандартные цветовые палитры (colormap), доступные дл€ использовани€: cool (оттенки голубого и пурпурного цветов), gray (оттенки серого цвета (традиционно используетс€, в частности, при подготовке графика к печати на черно-белом принтере)), hot (плавное изменение следующих цветов: белый Ц желтый Ц оранжевый Ц красный Ц черный), hsv (плавное изменение цветов радуги), jet
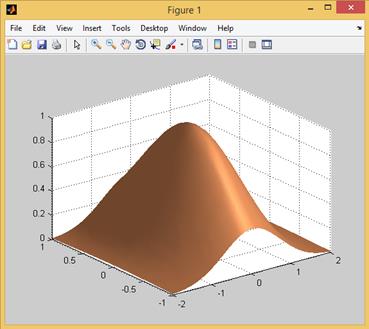
–ис. 2.12.8. ¬изуализаци€ поверхности с использованием функции surfl (режим цветовой палитры Ц copper; режим shading interp).
(плавное изменение следующих цветов: красный Ц желтый Ц зеленый Ц голубой Ц синий (используетс€ по умолчанию)), copper (дополнительна€ палитра с оттенками медного цвета), autumn (дополнительна€ палитра с плавным изменением следующих цветов: желтый Ц оранжевый Ц красный), winter (дополнительна€ палитра с оттенками синего и зеленого цветов), summer (дополнительна€ палитра с оттенками желтого и зеленого цветов), spring (дополнительна€ палитра с оттенками желтого и пурпурного цветов), pink (дополнительна€ палитра с оттенками коричневого цвета).
»змен€ть цветовую палитру можно с помощью функции
colormap('название палитры')
— помощью команды colormap('default') можно вернутьс€ к палитре, используемой по умолчанию.
»спользованна€ в вышеприведенном примере функци€ surfl Ђпредполагаетї, что в пространстве расположен некоторый источник света, освещающий поверхность. “акие поверхности выгл€д€т более естественно, если заменить заданную по умолчанию палитру цветов такими палитрами как gray, copper, pink и задать сглаживание цветов на графике с помощью команды shading interp.
¬ообще, многие приемы оформлени€ трехмерных графиков совпадают с теми, что уже были представлены ранее при рассмотрении двумерных графиков функций, завис€щих от одной переменной. ¬ частности, дл€ масштабировани€ удобно использовать функцию axis, в которую в трехмерном случае следует передать три пары скал€рных аргументов:
|
|
|
axis([xmin xmax ymin ymax zmin zmax])
ƒл€ трехмерных графиков, как и дл€ двумерных, можно использовать функции xlabel (выводит название оси ), ylabel (выводит название оси ), zlabel (выводит название оси  Ц относительно нова€, но очевидна€ команда), title (добавл€ет заголовок графика) и legend (добавл€ет легенду графика), а также наносить отметки на ос€х координат посредством функции set. ƒл€ того, чтобы разместить несколько трехмерных графиков в одном графическом окне, можно воспользоватьс€ функцией subplot.
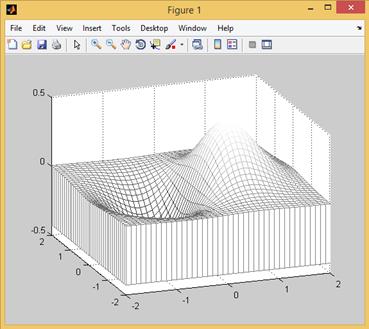
числу достаточно эффективных методов дополнительного оформлени€ трехмерных графиков можно отнести возможность вызвать функцию mesh с суффиксом z, т.е. функцию meshz, использование которой приводит к построению Ђграфика с пьедесталомї Ц из каждой граничной точки каркасной поверхности опускаетс€ перпендикул€р на плоскость и при достаточно мелком шаге сетки создаетс€ впечатление Ђзанавеса, опущенного по кра€м изображени€ї. “ак, например, график, приведенный на рис. 2.12.9, строитс€ с помощью следующей последовательности команд:
>> [X,Y]=meshgrid(-2:0.1:2);
>> Z=X.*exp(-X.^2-Y.^2);
>> colormap(gray)
>> meshz(X,Y,Z)
¬се трехмерные графики, рассмотренные ранее, визуализировались, по сути, лишь из одной точки обзора, т.е. оси координат , и на изображении всегда были ориентированы (повернуты) одинаково. “ем не менее, в системе MATLAB имеетс€ возможность, измен€€ точку обзора, рассмотреть созданное изображение с разных сторон.
“очка обзора Ц это позици€, с которой пользователь видит трехмерное изображение. –асположение точки обзора определ€етс€ двум€ параметрами: азимутом /az/ (т.е. углом, изменение которого означает вращение плоскости вокруг оси  против хода часовой стрелки (отсчитываетс€ от оси, противоположной , в направлении против часовой стрелки)) и углом возвышени€ /el/ (т.е. углом между отрезком, направленным из начала координат в точку обзора и плоскостью ). «аметим, что рассто€ние от точки обзора до изображени€ при этом не учитываетс€.
«аметим, что по умолчанию дл€ функций mesh, surf и surfl установлены значени€ az=-37.5 (градусов) и el=30 (градусов). ”бедитьс€ в этом можно посредством функции view, обратившись к ней должным образом:
>> [az,el]=view
az =
-37.5000
el =

–ис. 2.12.9. ¬изуализаци€ функции  с Ђпьедесталомї.
‘ункци€ view также позвол€ет изменить положение точки обзора, причем возможны сразу несколько вариантов ее вызова, в частности:
view([az,el])
view([x,y,z])
view(2)
view(3)
¬ первом случае входными аргументами рассматриваемой функции €вл€ютс€ значени€ азимута и угла возвышени€, во втором Ц декартовы координаты точки обзора, а третий и четвертый варианты обращени€ позвол€ют вернутьс€ к значени€м азимута и угла возвышени€, прин€тых по умолчанию дл€ двумерных (az=0 (градусов) и el=90 (градусов)) и трехмерных изображений (az=-37.5 (градусов) и el=30 (градусов)) соответственно.
¬ частности, если после построени€ представленного на рис. 2.12.9 Ђграфика с пьедесталомї выполнить команду view([-20,25]), то график изменит свой вид, поскольку мы уменьшили угол возвышени€ с 30 градусов до 25 градусов, а угол азимута изменили с -37.5 градусов на значение равное -20 градусам. ¬ результате точка получаем, что обзора графика находитс€ больше сбоку и преимущественно вдоль одной из независимых координат (рис. 2.12.10).
ќтметим, что рассмотренную операцию изменени€ ориентации в пространстве трехмерного графика можно выполнить и с помощью панели инструментов графического окна.
–ис. 2.12.10. ѕоверхность, задаваема€ функцией  (угол возвышени€ 25 градусов, азимутный угол -20 градусов).
–ассмотрим в качестве еще одного важного характерного примера задачу отображени€ функции  при и
при и  при условии расположени€ точки обзора снизу (рис. 2.12.11):
>> [X,Y]=meshgrid(-2:0.1:2);
>> Z=-2*X.*exp(-X.^2-Y.^2);
>> surf(X,Y,Z)
>> view(-37.5,-20)
јльтернативным и существенно более простым способом изменени€ точки обзора в системе MATLAB €вл€етс€ использование специальной кнопки на панели инструментов графического окна Figure.
≈сли в графическом окне отображаетс€ трехмерный график, эта кнопка ( ) имеет название Rotate 3D (вращать трехмерное изображение). ≈сли навести указатель мыши на данную кнопку, щелкнуть левой кнопкой мыши по кнопке Rotate 3D, после чего навести указатель мыши на трехмерное изображение, нажать левую кнопку мыши, и, не отпуска€ ее перемещать указатель мыши по экрану, то положение фигуры (и соответственно точки обзора) будет мен€тьс€, а в левой нижней части графика будут отображатьс€ значение параметров az и el, соответствующие текущему положению трехмерной фигуры. ≈сли же навести указатель на фигуру и щелкнуть по правой кнопке мыши, то отобразитьс€ контекстное меню с командами, поз-
|
|
|
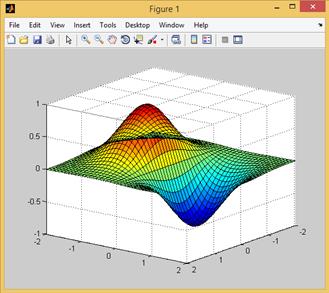
–ис. 2.12.11. ¬ид поверхности снизу.
вол€ющими вернутьс€ к положению фигуры по умолчанию, а также выбрать одну из трех проекций графика (на плоскости ,  , ). ¬ частности, на рис. 2.12.12 показана проекци€ поверхности на плоскость (это положение соответствует команде view(0,0)).
ƒл€ того, чтобы установить точное соответствие между цветом, отображенным на трехмерном графике, и значением функции, можно воспользоватьс€ командой colorbar, после вызова которой р€дом с графиком по€вл€етс€ столбик с текущей цветовой палитрой и цифрами, определ€ющими значени€ функции. Ётой команде соответствует кнопка ( ) Insert Colorbar (добавить цветовую палитру) на панели инструментов графического окна Figure. “ак, например, если ввести в командное окно команду colorbar либо щелкнуть на кнопке Insert Colorbar левой кнопкой мыши графическое окно с трехмерным изображением, показанным на рис. 2.12.11, примет вид, представленный на рис. 2.12.13.
≈ще большей реалистичности в визуализации трехмерных объектов можно добитьс€, задава€ параметры освещенности дл€ объекта.
ƒл€ про€влени€ отдельных участков поверхности графика, отображаемого в системе MATLAB, имеетс€ возможность включени€ дополнительных источников освещени€, реализованных в виде графических объектов типа light. —вет от такого рода источников смешиваетс€ с рассе€нным фоновым освещением (Ambientlight), цвет и сила которого встроены в виде
характеристик в объекты axes (свойство AmbientLightColor) и surface (свойство AmbientLight).
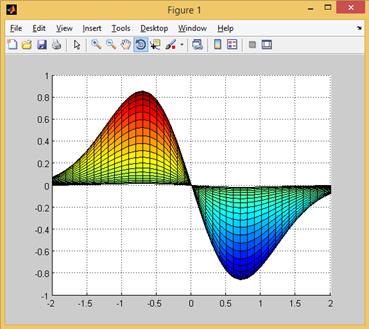
–ис. 2.12.12. ѕроекци€ на плоскость .

–ис. 2.12.13. ƒобавление цветовой палитры на график.
¬ частности, дл€ примера, показанного на рис. 2.12.9,
>> hsurfl=surfl(X,Y,Z)
hsurfl =
174.0081
>> set(hsurfl,'FaceLighting','phong','FaceColor','interp');
>> set(hsurfl,'AmbientStrength',0.5);
>> light('Position',[1 0 0],'Style','infinite');
>> light('Position',[1 0 0],'Style','infinite');
задаютс€ такие свойства поверхности (свойства графического объекта типа surface), которые вли€ют на результирующее изображение при использовании дополнительных источников света. ƒалее создаетс€ такой источник в позиции, определ€емой его свойством Position, и испускающий параллельные лучи (style=infinite, т.е. бесконечно удаленный источник).
роме того, можно задать цвет дополнительного источника подсветки поверхности графика (свойство Color объекта light). ƒл€ того, чтобы сделать источник света более сильным, следует продублировать его несколько раз, создава€ все новые источники в том же месте и с теми же свойствами, при этом дескрипторы каждого вновь создаваемого источника света нужно запоминать в соответствующих переменных. ѕри соблюдении этого услови€ впоследствии можно будет с помощью функции set измен€ть их свойства и суммарную силу (мощность) света (дл€ выключени€ конкретного источника необходимо задать его свойство Color равным black), добива€сь желаемого внешнего вида графика. ѕо сути, именно здесь про€вл€етс€ важное преимущество системы MATLAB при работе с ней в интерактивном режиме: можно оперативно оценить достигнутый результат и, если что-то не нравитс€, выполнить отдельные части работы (а не всю работу) заново.
ѕо умолчанию источник света (например, при использовании команды surfl) имеет следующие координаты: az=7.5 (градусов) и el=30 (градусов). ѕоложение источника света можно также изменить, задав дополнительным входным аргументом функции surfl вектор, включающий новые значени€ азимута и угла возвышени€. “ак, например, можно задать источник света, совпадающий с точкой обзора можно, использовав следующий набор команд:
>> [az,el]=view
>> surfl(X,Y,Z,[az,el])
—оздать источник света можно иначе и другим альтернативным способом Ц посредством функции camlight. Ќиже перечислены некоторые возможные варианты вызова последней:
camlight headlight Ц создать источник освещени€, расположение которого совпадает с точкой обзора;
camlight right (или camlight) Ц создать источник освещени€, наход€щийс€ правее и выше точки обзора;
camlight left Ц создать источник освещени€, наход€щийс€ левее и выше точки обзора;
camlight(az,el) Ц создать источник информации с требуемыми координатами.
ћногократное применение функции camlight с разными аргументами позвол€ет создать несколько источников света, расположенных в разных местах. ак уже отмечалось выше, вид освещенной поверхности во многом зависит от материала поверхности. ¬ системе MATLAB управл€ть свойствами материала, из которого создана поверхность, позвол€ет функци€ material, однако результаты вызова указанной функции станов€тс€ видны лишь после освещени€ поверхности источником света. Ќиже указаны несколько вариантов вызова функции material:
material shiny Ц сделать поверхность блест€щей;
material dull Ц сделать поверхность матовой;
material metal Ц сделать поверхность Ђметаллическойї;
material default Ц задать свойства материала поверхности, прин€тые по умолчанию.
—истема MATLAB позвол€ет рассмотреть трехмерный объект, изображенный в графическом окне, не только с разных сторон, но и с различного рассто€ни€ (по аналогии с объективом виртуальной камеры). »меютс€ возможности дл€ приближени€ и удалени€ трехмерных изображений, их перемещени€ и вращени€ относительно различных координатных осей (т.е., по сути, выполн€ть роль виртуального фотографа). –еализовать перечисленные функции позвол€ет специальна€ панель инструментов графического окна, котора€ называетс€ Camera (камера) и показана на рис. 2.12.14.

–ис. 2.12.14. ѕанель инструментов Camera.
ƒл€ того, чтобы отобразить данную панель следует выбрать в инструментальной панели графического окна раздел меню View, после чего отметить в ниспадающем меню пункт Camera Toolbar. ѕосле щелчка на нужной кнопке на этой панели управл€ть положением объекта и камеры можно либо с помощью мыши, либо посредством клавиш со стрелками. «аметим, впрочем, что все команды панели инструментов Camera продублированы в контекстном меню, которое можно открыть, щелкнув на изображении правой кнопкой мыши.
»так, дл€ трехмерных графиков также существует возможность измен€ть свойства условной камеры, фиксирующей сцену с графиком: можно мен€ть положение этой камеры, рассто€ние от стены, а также свойства ее объектива (это достаточно мощные способы вли€ть на изображени€). »змен€ть свойства указанной камеры можно с помощью дескрипторного метода.
ак уже отмечалось ранее, графическим объектом, соответствующим поверхности трехмерного графика функции, €вл€етс€ объект типа surface. ƒескриптор такого объекта возвращаетс€ функци€ми mesh, surf и surfl. ќбъект surface, в свою очередь, €вл€етс€ наследником объекта axes, получить описатель которого можно, вызвав функцию gca, котора€ возвращает описатель текущего объекта axes (в ситуаци€х, когда создано несколько таких объектов, перед вызовом функции следует щелкнуть левой клавишей мыши на выбираемом объекте axes). ѕолучив описатель, далее можно функцией set измен€ть свойства объекта axes, в частности, свойства, св€занные с камерой, фиксирующей сцену с расположенным на ней трехмерным графиком. ѕриведем список соответствующих свойств объекта axes:
>> hA=gca
hA =
173.0057
>> get(hA)
ActivePositionProperty = outerposition
ALim = [0.1 10]
ALimMode = auto
AmbientLightColor = [1 1 1]
Box = off
CameraPosition = [-18.2628 -23.8006 4.33013]
CameraPositionMode = auto
CameraTarget = [0 0 0]
CameraTargetMode = auto
CameraUpVector = [0 0 1]
CameraUpVectorMode = auto
CameraViewAngle = [10.3396]
CameraViewAngleMode = auto
CLim = [-0.428838 0.428838]
CLimMode = auto
Color = [1 1 1]
CurrentPoint = [ (2 by 3) double array]
ColorOrder = [ (7 by 3) double array]
DataAspectRatio = [4 4 1]
DataAspectRatioMode = auto
DrawMode = normal
FontAngle = normal
FontName = Helvetica
FontSize = [10]
FontUnits = points
FontWeight = normal
GridLineStyle =:
Layer = bottom
LineStyleOrder = -
LineWidth = [0.5]
MinorGridLineStyle =:
NextPlot = replace
OuterPosition = [0 0 1 1]
PlotBoxAspectRatio = [1 1 1]
PlotBoxAspectRatioMode = auto
Projection = orthographic
Position = [0.13 0.11 0.775 0.815]
TickLength = [0.01 0.025]
TickDir = out
TickDirMode = auto
TightInset = [0.0571429 0.05 0.0303571 0.00238095]
Title = [175.006]
Units = normalized
View = [-37.5 30]
XColor = [0 0 0]
XDir = normal
XGrid = on
XLabel = [176.006]
XAxisLocation = bottom
XLim = [-2 2]
XLimMode = auto
XMinorGrid = off
XMinorTick = off
XScale = linear
XTick = [-2 -1 0 1 2]
XTickLabel =
-2
-1
XTickLabelMode = auto
XTickMode = auto
YColor = [0 0 0]
YDir = normal
YGrid = on
YLabel = [177.006]
YAxisLocation = left
YLim = [-2 2]
YLimMode = auto
YMinorGrid = off
YMinorTick = off
YScale = linear
YTick = [-2 -1 0 1 2]
YTickLabel =
-2
-1
YTickLabelMode = auto
YTickMode = auto
ZColor = [0 0 0]
ZDir = normal
ZGrid = on
ZLabel = [178.006]
ZLim = [-0.5 0.5]
ZLimMode = auto
ZMinorGrid = off
ZMinorTick = off
ZScale = linear
ZTick = [-0.5 0 0.5]
ZTickLabel =
-0.5
0.5
ZTickLabelMode = auto
ZTickMode = auto
BeingDeleted = off
ButtonDownFcn =
Children = [174.009]
Clipping = on
CreateFcn =
DeleteFcn =
BusyAction = queue
HandleVisibility = on
HitTest = on
Interruptible = on
Parent = [1]
Selected = off
SelectionHighlight = on
Tag =
Type = axes
UIContextMenu = []
UserData = []
Visible = on
ѕостроение линий уровн€.
ƒл€ построени€ так называемых контурных графиков в MATLAB предусмотрены функции как contour, contourf и contour3, с помощью которых стро€тс€ так называемые линии уровн€ или изолинии. ѕод последними понимаютс€ кривые, получающиес€ в результате пересечени€ поверхности  с плоскост€ми
  . Ёти линии можно спроектировать на одну плоскость, и получить двумерное изображение, а можно воспроизвести как пространственные кривые и получить трехмерное изображение. Ќагл€дным примером двумерных изображений изолиний €вл€ютс€ линии рельефа поверхности на топографических картах (по последним, как известно, можно легко локализовать впадины и вершины, оценить их глубины и высоты, особенно, если в разрывах изолиний проставлены числовые значени€ соответствующих уровней).
¬ частности, с использованием функции contour можно строить проекции линий уровн€ на плоскости . Ќеобходимо отметить, что данна€ функци€ имеет несколько вариантов вызова. “ак, например, если обратитьс€ к ней с трем€ аргументами (в данном случае X, Y, и Z Ц матрицы одинаковой размерности, задающие координаты узлов сетки, в которых определены аппликаты поверхности).
>> [X,Y]=meshgrid(-2:0.1:2);
>> Z=-2*X.*exp(-X.^2-Y.^2);
>> colormap(gray)
>> contour(X,Y,Z)
то получим график, представленный на рис. 2.12.9 (заметим, что в представленном фрагменте использована сера€ полутонова€ матрица цветности (colormap(gray)).
«аметим, что если область определени€ поверхности квадратна€ и шаги по ос€м и совпадают, то вместо пары аргументов X, Y может быть задан только один массив.
ƒл€ того, чтобы такой график стал более информативным, целесообразно возле каждой линии уровн€ отобразить значение, которое соответствует значению функции. ƒл€ этого используетс€ функци€ clabel(C,h), при вызове которой необходимо задать два входных параметра Ц матрицу C, содержащую информацию о лини€х уровн€ (эту матрицу можно рассматривать как таблицу, состо€щую из двух строк Ц перва€ колонка задает значение уровн€ изолинии и количество содержащихс€ в ней точек, следом располагаетс€ указанное количество пар  с координатами точек изолинии; вслед за первой изолинией в том же формате располагаетс€ информаци€ о второй изолинии и т.д. (данный массив требуетс€, когда необходимо оцифровывать изолинии, т.е. включать в разрыв линии значение ее уровн€), и вектор h, представл€ющий собой набор указателей на созданные графические массивы (также требуетс€ при оцифровке изолиний). “ребуемые дл€ функции clabel параметры автоматически генерирует функци€ contour, если ее вызвать с двум€ входными аргументами (параметрами) C и h:
>> [C,h]=contour(X,Y,Z);
>> clabel(C,h)
“аким образом, если выполнить приведенные ниже команды, можно получить график, показанный на рис. 2.12.16.
»спользование функции contourf в виде
>> contourf(X,Y,Z)
позвол€ет заполнить разными цветами промежутки между изолини€ми (рис. 2.12.17), что может оказатьс€ весьма удобным при визуализации результатов решени€ тестовых, модельных и практически важных задач.
ƒл€ построени€ изолиний в пространстве примен€етс€ функци€ contour3 (рис. 2.12.18).
>> contour3(X,Y,Z)
«адав четвертым входным аргументом функций contour и contour3 скал€рное значение, можно указать количество уровней, дл€ которых следует построить изолинии (по умолчанию количество уровней выбираетс€ автоматически). оличество самих изолиний при этом может не совпадать с указанным количеством уровней, т.к. соответствующа€ плоскость может дать несколько разных линий пересечени€ с поверхностью.
«аметим, что среди многочисленных параметров функций contour, contourf и contour3, могут присутствовать пары типа
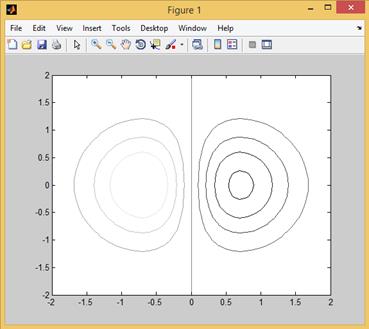
–ис. 2.12.15. ѕример использовани€ функции contour.
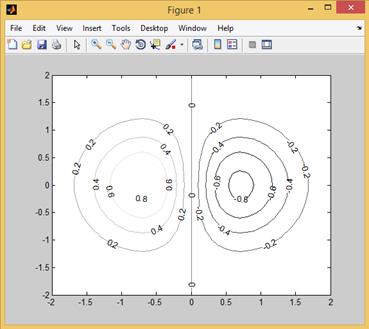
–ис. 2.12.16. ѕример выполнени€ оцифровки изолиний.
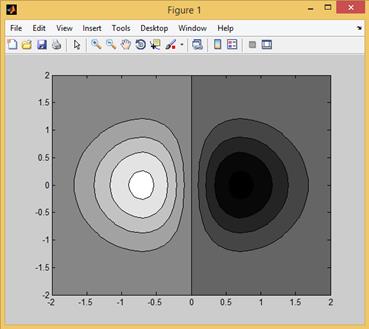
–ис. 2.12.17. ѕример использовани€ функции contourf.
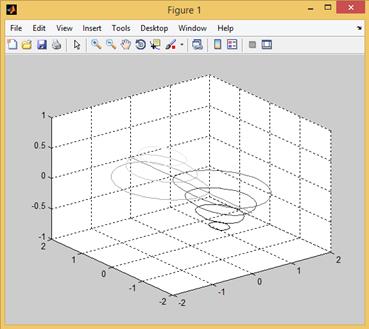
–ис. 2.12.18. ѕример использовани€ функции contour3.
('—войство', значение)
инициализирующие значени€ соответствующих свойств.
ƒл€ изменени€ свойств изолиний можно воспользоватьс€ массивом указателей, который возвращает функци€ contour3:
>> [X,Y]=meshgrid(-2:0.1:2);
>> Z=-2*X.*exp(-X.^2-Y.^2);
>> colormap(gray)
>> [C,h]=contour3(X,Y,Z,7);
>> set(h,'LineWidth',5)
–езультат работы представленного фрагмента, в котором толщина изолиний была увеличена до 5 пунктов, приведен на рис. 2.12.19.
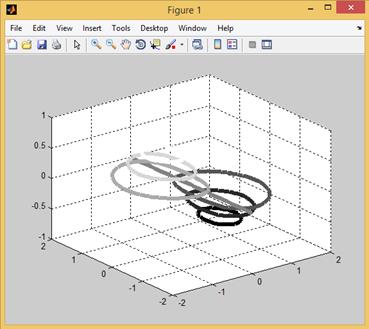
–ис. 2.12.19. ѕример утолщенных пространственных изолиний.

