


Ћабораторна€ работа є1
»зучение и освоение методики моделировани€ ј—” в операционной среде
SIMULINK - MATLAB.
÷елью насто€щей работы €вл€етс€ ознакомление с основными программными продуктами системы MATLAB, примен€емыми при моделировании ј—”, и правилами их использовани€.
1.1. «апуск и краткое описание системы.
ƒл€ запуска системы SIMULINK необходимо предварительно выполнить запуск основной программы MATLAB. –абочий стол MATLAB показан на рис. 1.1.
ќколо кнопки SIMULINK показана всплывающа€ подсказка, котора€ по€вл€етс€
при наведении указател€ мыши на соответствующую кнопку. ≈сли нажать эту кнопку, то по€вл€етс€ окно обозревател€ библиотеки блоков Simulink Library Browser (рис. 1.2).

–ис. 1.1
—лева в по€вившемс€ окне представлен в виде дерева список разделов библиотеки. ƒл€ того, чтобы свернуть или развернуть узел дерева, необходимо
щелкнуть один раз его знак ЂЦї или Ђ+ї. ¬ правой части окна показаны разделы
библиотеки в виде набора пиктограмм с надпис€ми. ¬ыбранный раздел (выбор осуществл€етс€ одним щелчком левой клавиши мыши) затемнен (на рис. 1.2 это раздел Continuous). –аскрытие раздела осуществл€етс€ двойным щелчком по названию раздела. ѕри этом содержимое выбранного раздела отображаетс€ в правой части окна (рис. 1.3).
Ѕиблиотека системы SIMULINK содержит следующие разделы:
Ј Continuous Ц блоки аналоговых элементов;
Ј Discontinuous Ц блоки нелинейных элементов;
Ј Discrete Ц блоки дискретных элементов;
Ј Look-Up Tables Ц блоки таблиц;
Ј Math Operations Ц блоки элементов выполнени€ математических операций;
Ј Model Verification Ц блоки проверки свойств сигналов;
Ј Model- Wide Utilities Ц раздел дополнительных утилит;
Ј Ports & Subsystems Ц порты и подсистемы;

 |
–ис. 1.2
–ис. 1.3
Ј Signal Attributes Ц блоки задани€ свойств сигналов;
Ј Signal Routing Ц блоки маршрутизации сигналов;
Ј Sinks Ц блоки отображени€ сигналов;
Ј Sources Ц блоки источников сигналов;
Ј User-Defined Function Ц функции, определ€емые пользователем.
¬озврат к закрытому состо€нию разделов осуществл€етс€ выбором команды
Go up a level из раскрывающегос€ списка после нажати€ правой кнопки мыши на поле раскрытого раздела.
1.2. —оздание модели и еЄ настройка.
Ёта операци€ выполн€етс€ в следующей последовательности.
1. ќткрытие рабочего окна модели с помощью выбора команды File/New/Model.
2. –азмещение блоков в окне модели. Ѕлоки извлекаютс€ из соответствующих разделов библиотеки. ƒл€ этого требуемый блок отмечаетс€ мышкой и, нажав левую клавишу, Ђперетаскиваетс€ї в рабочее окно. ”даление ненужного блока достигаетс€ отметкой блока (левой клавишей мыши) и нажатием клавиши Delete на клавиатуре.
3. —оединение блоков. ƒл€ этого следует подвести курсор к выходному гнезду
блока, нажать левую клавишу мыши и, не отпуска€ еЄ, провести линию к входному гнезду другого блока. ƒл€ удалени€ линии необходимо выделить еЄ и нажать клавишу Delete на клавиатуре.
4. Ќастройка блоков. ак правило, требуетс€ измен€ть значени€ параметров блоков, установленных по умолчанию. ƒл€ этого необходимо дважды щелкнуть
|
|
|
левой клавишей мыши по изображению блока. ќткроетс€ окно параметров данного блока. —пособ изменени€ параметров различен дл€ различных блоков, поэтому рекомендуетс€ следовать надпис€м окон параметров блоков. —ледует помнить, что
 |
в качестве дес€тичного разделител€ используетс€ точка, а не зап€та€. Ќапример, на рис. 1.4 показано окно настройки параметров блока Transfer Fcn.
–ис. 1.4
оличество единиц в квадратных скобках соответствует числу слагаемых в полиномах числител€ (Numerator) и знаменател€ (Denominator). Ќапример, (рис. 1.4), единица в числителе соответствует коэффициенту при 
 , равному единице. ƒве единицы в знаменателе означают единичные коэффициенты при
  и при . ≈сли в знаменателе поставить три числа, то они будут соответствовать коэффициентам квадратного трехчлена.
1.3. «апуск модели на выполнение.
ѕосле соединени€ всех звеньев модели и их настройки подготовленна€ модель должна быть запущена на выполнение. «апуск осуществл€етс€ нажатием в окне модели кнопки Start Simulation, помеченной черным треугольником и наход€щейс€ под надписью Help. “акже можно использовать дл€ запуска модели
команду Start в раскрывающемс€ списке после нажати€ клавиши Simulation в строке команд рабочего окна. ¬ этом же списке команда Simulation parameters позвол€ет мен€ть врем€ моделировани€ (Stop time) и выбрать любой из имеющихс€ в программном обеспечении методов интегрировани€ дифференциальных уравнений (правое окно строки Solver options).
¬ рамках насто€щих лабораторных работ, посв€щенных изучению основных
положений линейной “ј”, моделирование элементов и систем следует выполн€ть с помощью специального программного продукта MATLAB, называемого Linear analysis, предоставл€ющего полный спектр программных средств дл€ исследовани€ и регистрации всевозможных характеристик любых линейных звеньев и систем.
«апуск Linear analysis осуществл€етс€ нажатием кнопки Tools в рабочем окне и выбором строки Linear analysis в раскрывшемс€ списке. ѕосле нажати€ этой строки происходит запуск программного продукта и вывод двух окон: 1) LTI Viewer 2) Model
_Inputs_and_Outputs. ѕервое окно €вл€етс€ экраном дл€ вывода различных характеристик, второе содержит модули Input Point и Output Point, которые должны быть Ђперенесеныї в окно модели и подсоединены к входу и выходу исследуемой модели. ѕосле выполнени€ соединений можно приступать к рассмотрению характеристик. ƒл€ этого в поле экрана LTI Viewer необходимо нажать клавишу Simulink и выбрать строку Get Linearized Model. ѕо умолчанию первой строитс€ переходна€ характеристика (Step).
ѕри нажатии правой кнопки мыши на поле экрана LTI Viewer по€вл€етс€ небольшое панно, на котором можно задать вид и тип характеристик, их параметры, вид
графиков. ѕерва€ строка задает вид характеристики: переходна€ (Step), импульсна€ переходна€ характеристика (Impulse), логарифмические амплитудно-частотна€ и
фазочастотна€ характеристика (Bode), логарифмическа€ амплитудно-частотна€ характеристика (Bode Magnitude), амплитудно-фазова€ характеристика (Nyquist), логарифмическа€ амплитудно-частотна€ характеристика (Nichols), нули и полюса (Pole/Zero). —трока Characteristics выводит координаты: точки максимума графика (Peak Response), окончани€ переходного процесса (Setting Time), первого согласовани€ с линией установившегос€ состо€ни€ (Rise Time), полного окончани€ переходного процесса (Steady Time). ѕри оценке Ћј‘„’ (Bode) строка Characteristics позвол€ет, кроме Peak Response, определить запас устойчивости по модулю (Stability (Minimum Crossing)), запас устойчивости по фазе (Stability (All Crossing)).
|
|
|
Ќажатие строки Grid позвол€ет оснастить графики соответствующей сеткой: пр€моугольной (временные графики), логарифмической (Ћј‘„’ или Ќикольс), пол€рной (Ќули и полюса).
—трока Properties (—войства) позвол€ет определить: название характеристики и наименование осей графика (Labels), границы величин по ос€м X и Y (Limits), единицы измерени€ величин (Units), характеристики (Characteristics) зон дл€ оценки врем€ первого согласовани€ и времени переходного процесса. ѕо умолчанию зона первого согласовани€ установлена 10-90%. ” нас прин€то устанавливать 0-100%. «она дл€ оценки времени переходного процесса по умолчанию установлена на уроне 2%, у нас чаще всего используют 5%-ую зону. –азумеетс€, значени€ времен Rise Time и Setting Time завис€т от величин зон.
1.4. ¬ывод результатов моделировани€.
„асто необходимо сохранить результаты моделировани€ в виде графиков переходного процесса или частотных характеристик. ƒл€ этого в Linear analysis имеютс€
все возможности. „тобы вывести график дл€ отчета, надо в раскрытой клавише File экрана LTI Viewer нажать строку Print to Figure. “отчас же по€витс€ копи€ фигуры. ¬ копии необходимо раскрыть клавишу Edit и нажать строку Copy Figure. “еперь в документе Word достаточно нажать клавишу Ђ¬ставитьї и график по€витс€ в вашем отчете. ѕрежде чем создавать копию графика, целесообразно снабдить график по€сн€ющими сведени€ми, содержащими координаты характерных точек графика (максимум переходного процесса, врем€ переходного процесса и т.п.). ѕример такого оформлени€ графика приведен на рис. 1.5.

–ис. 1.5
—оздание такого по€снени€ достигаетс€ подведением указател€ мыши к характерной точке графика. ƒл€ фиксации по€сн€ющего табло нужно нажать левую клавишу мыши.
≈сли необходимо вывести в отчет несколько графиков одновременно на одном рисунке, то следует воспользоватьс€ клавишей Edit экрана LTI Viewer и инициировать
команду Plot Configurations. ќткроетс€ окно, в котором можно выбрать одну из шести возможных комбинаций, и задать желаемый перечень характеристик. ѕример вывода
четырех характеристик в одном окне приведен на рис. 1.6.

–ис. 1.6
ак правило, в отчет всегда выводитс€ схема компьютерной модели, исследова-ние которой выполн€етс€. „тобы сохранить в отчете схему модели, еЄ нужно предварительно выделить, затем в окне рабочей модели нажать клавишу Edit и выбрать строку Copy model to clipboard. ¬ Word достаточно нажать Ђ¬ставитьї (рис. 1.7). ≈сли размеры рисунка по какой-либо причине ¬ас не устраивают, можно воспользоватьс€ предварительно программой Paint.
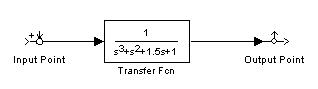
–ис. 1.7
1.5. ѕрограмма выполнени€ работы.
1. ќткрыть окно рабочей модели и создать модель звена 3-го пор€дка, подобного
звену, изображенному на рис. 1.7. »нициировать запуск программы LTI Viewer. ќсвоить процедуры построени€ и определени€ параметров всех возможных характеристик исследуемого звена. ѕодготовить графики к выводу на печать в отчете.
2. —оздать окно дл€ вывода п€ти характеристик (ѕ’, »ѕ’, Ћј‘„’, ј‘’, расположение нулей и полюсов). ќтметить на всех п€ти графиках точки параметров гра-
фиков. ќрганизовать вывод полученной информации в отчет.
1.6. —одержание отчета.
ќтчет должен содержать:
1.6.1. название, цель и содержание работы;
1.6.2. описание операций построени€ графиков и их оформлени€ на печать;
1.6.3. копии всех графиков, созданных в ходе выполнени€ работы;
1.6.4. выводы по работе.
Ћабораторна€ работа є2
»сследование временных и частотных характеристик типовых звеньев ј—”.
÷елью работы €вл€етс€ изучение и исследование временных и частотных характери≠стик корректирующего звена первого пор€дка, апериодического звена 2-го по≠р€дка, колебательного звена 2-го пор€дка, консервативного звена 2-го пор€дка.
|
|
|
2.1. раткие теоретические сведени€.
—овременные ј—” состо€т из элементов, имеющих различную физическую природу, конструктивное исполнение, способ представлени€ информации управлени€,
тип источников питани€ т.п. ƒинамические свойства этих элементов во многих случа€х можно описать одними и теми же дифференциальными уравнени€ми. Ёто обсто€тель-ство позволило выделить р€д динамических звеньев, имеющих типовые динамические
модели. “акие звень€ называютс€ типовыми. —реди типовых динамических моделей наиболее часто употребл€емыми €вл€ютс€ звень€ 2-го пор€дка (апериодическое, колебательное и консервативное) и корректирующее звено 1-го пор€дка.
јпериодическое звено второго пор€дка относитс€ к группе инерционных звеньев,
имеющих монотонный (без перерегулировани€) переходный процесс. ќно характеризуетс€ наличием двух источников инерционности и описываетс€ уравнением
 .
.
ѕереходна€ характеристика  .
.
»мпульсна€ переходна€ характеристика  .
.
ѕередаточна€ функци€ апериодического звена 2-го пор€дка

“аким образом, апериодическое звено 2-го пор€дка может быть представлено в виде двух звеньев 1-го пор€дка, соединенных последовательно.
¬ыражение амплитудно-фазовой характеристики  .
.
”стойчивое колебательное звено 2-го пор€дка имеет дифференциальное
уравнение 
где  коэффициент демпфировани€,
  .
.
ѕереходна€ характеристика 
»мпульсна€ переходна€ характеристика  .
.
ѕередаточна€ функци€ колебательного звена 2-го пор€дка

јмплитудно-фазова€ характеристика  .
.
Ќаконец, консервативное звено 2-го пор€дка имеет дифференциальное уравнение

что следует из дифференциального уравнени€ устойчивого колебательного звена 2-го пор€дка при  ѕереходна€ характеристика консервативного звена имеет вид

»мпульсна€ переходна€ характеристика 
ѕередаточна€ функци€ консервативного звена 2-го пор€дка  .
.
јмплитудно-фазова€ характеристика 
орректирующее звено характеризуетс€ дифференциальным уравнением

—войства звена, в том числе переходна€ и импульсна€ переходна€ характеристики,
завис€т от соотношени€ посто€нных времени “ 1 и “ 2. ѕри  звено обладает интегрирующим эффектом, при
  звено имеет дифференцирующие свойства.
ѕереходна€ характеристика имеет следующий вид: 
»мпульсна€ переходна€ характеристика 
ѕередаточна€ функци€ корректирующего звена 
јмплитудно-фазова€ характеристика  имеет вид полукругов, расположенных в четвертом квадранте при и во втором квадранте при .
2.2. ѕрограмма работы.
1. ќткрыть рабочее окно SIMULINK и создать модель корректирующего звена пер≠вого пор€дка. ѕараметры звена получить у преподавател€. «апустить Linear analysis,
ввести в рабочую модель модули Input Point и Output Point и организовать вывод на эк≠ран LTI Viewer одновременно 4-х характеристик звена в одном окне: переходной харак≠теристики  (Step), импульсной переходной характеристики
  (Impulse),
логарифмической амплитудно-частотной и фазо-частотной характеристик Ћј‘„’  и
и  - (Bode), амплитудно-фазовой характеристики ј‘’
  (Nyquist).
—набдить параметры характеристик по€сн€ющими надпис€ми. ¬ывести рисунок в Word
отчет.
2. —оздать модель апериодического звена 2-го пор€дка. «начени€ посто€нных вре≠мени задает преподаватель. ќрганизовать вывод в отчет таких же характеристик, как и в п.1 программы.
3. —оздать модель устойчивого колебательного звена 2-го пор€дка. «начение коэф≠фициента демпфировани€ получить у преподавател€. ѕроделать такую же последовательность операций по оформлению и выводу графиков, как в п.1.
4. —оздать модель консервативного звена 2-го пор€дка (в передаточной функции
|
|
|
предыдущего пункта положить  ). —оздать рисунок из тех же характеристик, что и в предыдущих пунктах, и поместить рисунок в отчет.
“аблица
| ¬ариант | орректирующее звено

| јпериодическое звено 2-го пор€дка

| олебательное звено 2-го пор€дка

| |||||
 сек сек
|  сек сек
| 
| сек
| сек
|
|  сек сек
| 
| |
| 0,1 | 0,6 | 1,0 | 0,65 | 1,5 | 0,6 | 0,5 | 0,2 | |
| 0,2 | 0,7 | 1,5 | 0,75 | 1,7 | 0,8 | 0,75 | 0,3 | |
| 0,3 | 0,8 | 2,0 | 0,85 | 1,9 | 1,0 | 1,0 | 0,4 | |
| 0,4 | 0,9 | 2,5 | 0,95 | 2,1 | 1,2 | 1,25 | 0,5 | |
| 0,5 | 1,0 | 3,0 | 1,05 | 2,3 | 1,4 | 1,5 | 0,6 | |
| 0,6 | 0,1 | 3,5 | 1,15 | 2,5 | 1,6 | 1,75 | 0,7 | |
| 0,7 | 0,2 | 4,0 | 1,25 | 2,7 | 1,8 | 2,0 | 0,8 | |
| 0,8 | 0,3 | 4,5 | 1,35 | 2,9 | 2,0 | 2,25 | 0,75 | |
| 0,9 | 0,4 | 5,0 | 1,45 | 3,1 | 2,2 | 2,5 | 0,8 | |
| 1,0 | 0,5 | 5,5 | 1,55 | 3,3 | 2,4 | 3,0 | 0,9 |
2.3. —одержание отчета.
2.3.1. название, цель и содержание работы;
2.3.2. описание операций построени€ графиков и их оформлени€ на печать;
2.3.3. копии всех графиков, созданных в ходе выполнени€ работы, снабженных соответствующими формулами из теоретического раздела;
2.3.4. выводы по работе.
Ћабораторна€ работа є3.

