


1 ѕредставить описательную статистику, характеризующую данные
1.1 ¬вести данные в Minitab for Windows
1.2 Ќа панели меню выбрать команду (–ис.1)
StatàBasic Statistics à Display Descriptive Statistics

–ис.1 ¬ыбор инструмента анализа
1.3 Ќа экране раскроетс€ диалоговое окно Display Descriptive Statistics, представленное на рис.2.

–ис.2 ƒиалоговое окно Display Descriptive Statistics приложени€ Minitab
- в поле Variables выбрать значение Profit (C1)
- щелкнуть на кнопке Graphs, и на экране раскроетс€ диалоговое окно Display Descriptive Statistics- Graphs
- выбрать в списке значений Graphical Summary и щелкнуть на кнопке OK
- щелкнуть на кнопке OK в диалоговом окне Display Descriptive Statistics, и на экран будут выведены результаты расчета (рис.3).
–ис. 3. –езультаты расчета описательных статистик
1.4 ѕо рис.3 можно получить следующие данные, представленные в таб. 1.
“аблица 1 - –езультаты расчета описательных статистик
| —окращение в Minitab | –асшифровка сокращени€ |
| Mean | —реднее значение |
| StDev | —тандартное отклонение |
| Skewness | јсимметри€, если значение стремитс€ к нулю - данные симметричны, больше нул€ - положительное несимметричное распределение, меньше нул€ Ц отрицательное несимметричное распределение |
| Kurtosis | Ёксцесс - уровень, в котором набор данных €вл€етс€ пиковым. ƒл€ нормального распределени€ эксцесс равен нулю, распределение с более острым пиком будет иметь положительное значение эксцесса, распределение с более плоским пиком - отрицательное значение эксцесса. |
| Minimum | ћинимальное значение |
| Median | ћедиана |
| Maximum | ћаксимальное значение |
| 1st Quartile | ѕервый квартиль. 25 % данных меньше или равны этому значению |
| 3rd Quartile | “ретий квартиль (Q3). 75 % данных меньше или равны этому значению. |
| 95% confidence interval for Mu | 95% доверительный интервал дл€ средней |
| 95% confidence interval for Sigma | 95% доверительный интервал дл€ стандартного отклонени€ |
| 95% confidence interval for Median | 95% доверительный интервал дл€ медианы |
1.5 ѕо полученным данным сделать выводы.
2 ќпределить тип исходных данных
2.1 Ќа панели меню выбрать команду GraphàTime Series Plot и ввести соответствующие данные. –езультат построени€ дл€ представлен на рис.4.

–ис.4 ѕрибыль предпри€ти€ ј
2.2 Ќа панели меню выбрать команду StatàTime Series à Autocorrelation. Ќа экране раскроетс€ диалоговое окно Autocorrelation Function, представленное на рис.5.
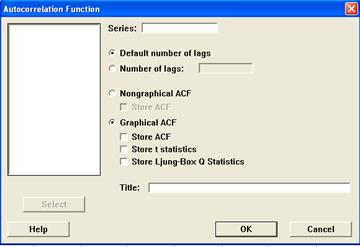
–ис.5 ƒиалоговое окно Autocorrelation Function приложени€ Minitab
- в поле Series выбрать значени€ (C1)
- отметить Store ACF, Store t statistics и Store Ljung-Box Q Statistics
щелкнуть на кнопке OK в диалоговом окне Autocorrelation Function, и на экран будут выведены результаты расчета, представленные на рис.6 и в таблице 5.
¬ таблице 5 прин€ты следующие обозначени€
- Lag Ц период запаздывани€;
- ACF1 Ц коэффициенты автокоррел€ции
- TSTA1 Ц результаты t-статистики;
- LBQ1 Ц результат Q-статистики.
|
|
|
-

–ис. 6. –езультаты расчета автокоррел€ции (коррелограмма)
“аблица 5 Ц –езультаты автокоррел€ционного
| Lag | ACF1 | TSTA1 | LBQ1 |
| 0,35720483 | 2,369428777 | 6,005880595 | |
| 0,11732431 | 0,694639567 | 6,669222215 | |
| 0,2401706 | 1,406630878 | 9,516739219 | |
| 0,68599833 | 3,848422097 | 33,32878062 | |
| 0,06785047 | 0,294265165 | 33,56770013 | |
| -0,2190849 | -0,948299259 | 36,1242353 | |
| -0,1196512 | -0,50763371 | 36,90738126 | |
| 0,28073742 | 1,184145494 | 41,33845126 | |
| -0,2148486 | -0,878658885 | 44,00781379 | |
| -0,419388 | -1,685831281 | 54,47822112 | |
| -0,2919431 | -1,104369035 | 59,70571017 |
— помощью механизма автокоррел€ции могут изучатьс€ наборы данных имеющих тренд и сезонность. оэффициенты автокоррел€ции дл€ различных значений запаздывани€ величин во времени используютс€ дл€ отождествлени€ моделей поведени€ данных, присутствующих во временных р€дах.
≈сли р€д случаен, то коэффициенты автокоррел€ции между Yt и Yt-k близки к нулю, т.е. последовательные значени€ временного р€да не св€заны друг с другом.
≈сли у р€да существует тренд, значени€ Yt и Yt-k имеют сильную коррел€цию, причЄм коэффициенты существенно отличны от нул€, дл€ нескольких первых периодов запаздывани€, а с увеличением периода постепенно убывают до нул€.
≈сли р€д имеет сезонную компоненту, значительный коэффициент автокоррел€ции будет наблюдатьс€ дл€ периодов, равных сезонному периоду или кратных ему.
≈сли р€д €вл€етс€ случайным, практически все коэффициенты автокоррел€ции должны находитьс€ внутри интервала, содержащего нуль, плюс или минус определЄнное количество число стандартных ошибок, т.е. при заданном уровне значимости р€д может считатьс€ случайным, если вычисленные коэффициенты автокоррел€ции наход€тс€ внутри интервала, ограниченного выражением 
јвтокоррел€ци€ дл€ первых периодов запаздывани€ таблицы 5 существенно отличны от нул€ и затем убывают. ƒл€ периода запаздывани€ 11 коэффициент LBQ = 59,70571017, что превышает значение  равное 19,675 (получено при уровне значимости 0,05). —ледовательно данные имеют значительную автокоррел€цию и демонстрируют заметный тренд. роме того, по полученным данным видно, что прибыль предпри€ти€ ј носит €рко выраженный сезонный характер с периодом 4 (квартал).
ѕри выборе оптимального метода прогнозировани€ дл€ конкретной задачи предварительно следует определить: чем обусловлена необходимость прогноза; конкретную сферу применени€ дл€ результатов прогноза; период прогнозировани€; требовани€ к исходным данным; необходимую точность прогноза; стоимость прогноза.
—тационарные методы прогнозировани€ используютс€ в следующих случа€х: воздействи€, порождающие р€д, стабилизировались, и окружающа€ среда, в которой р€д существует, относительно неизменна; в силу недостатка данных либо дл€ упрощени€ объ€снени€ или реализации прогноза не≠обходимо использовать очень простую модель; стабильность может быть достигнута за счет простой корректировки таких факторов, как рост населени€ или инфл€ци€; р€д можно преобразовать в стабильный; р€д представл€ет собой множество ошибок прогноза, полученных в результате применени€ метода прогнозировани€, который может считатьс€ неадекватным.
ћетоды прогнозировани€, которые могут примен€тьс€ по отношению к стационарным р€дам, включают в себ€ наивные методы: методы простого усреднени€, скольз€щие средние, простое экспоненциальное сглаживание и методы авторегрессионого скольз€щего среднего (методы Ѕокса-ƒженкинса).
|
|
|
ћетоды прогнозировани€ дл€ р€дов, обладающих трендом, используютс€ в следующих случа€х: повышение производительности труда и применение новых технологий ведут к изменению стил€ жизни; рост населени€ вызывает увеличение потребностей в товарах и услугах; покупательна€ способность валюты за счет инфл€ции оказывает вли€ние на общие экономические показатели; возрастает признание продукта на рынке
јппарат прогнозировани€, который должен использоватьс€ дл€ прогнозировани€ р€дов, имеющих тренд, Ч это метод скольз€щих средних, метод линейного экспоненци≠ального сглаживани€ ’ольта (Holt), проста€ регресси€, возрастающие кривые, экспо≠ненциальные модели и методы авторегрессионых интегрированных скольз€щих средних (методы ЅоксаЧƒженкинса).
ћетоды прогнозировани€ дл€ сезонных данных используютс€ в следующих случа€х: на изучаемую величину вли€ет погода; рассматриваема€ величина определ€етс€ годичным циклом;.
ћетоды, которые следует использовать дл€ прогнозировани€ сезонных р€дов, вклю≠чают классическое разложение, экспоненциальное сглаживание ¬ин≠тера (Winter), многомерную регрессию временного р€да и методы Ѕокса-ƒженкинса.
ћетоды прогнозировани€ дл€ циклических данных используютс€ в следующих случа€х: на интересующую величину вли€ет бизнес-цикл; имеют место изменени€ в общественных вкусах; возникают изменени€ в народонаселении; происход€т сдвиги в цикле производства продуктов потреблени€.
јппарат, который необходимо использовать дл€ прогнозировани€ циклических р€≠дов, включает классическое разложение, экономические индикаторы, эконометрические модели, многомерную регрессию и методы Ѕокса-ƒженкинса.
¬ итоге можно сделать следующие выводы:
1. —татистически сложные или комплексные методы прогнозировани€ действительно не привод€т в об€зательном пор€дке к получе≠нию более точных прогнозов, чем более простые методы.
2. –азные показатели точности (MAD, MSE, ћј–≈), используемые дл€ оценки различных методов прогнозировани€, дают согласованные результаты.
3. омбинирование результатов трех экспоненциальных сглаживающих методов превосходит, в среднем, отдельные комбинируемые методы и дает наилучший эффект в сравнении с другими методами.
4. Ёффективность различных методов прогнозировани€ зависит от отдаленности прогноза во времени и типа (ежегодные, ежеквартальные, ежемес€чные) анализи≠руемых данных. ќдни методы дают большую точность дл€ короткого промежутка времени, в то врем€ как другие больше подход€т дл€ составлени€ длительных прогнозов. Ќекоторые методы хорошо работают с ежегодными данными, а другие более эффективны дл€ ежеквартальных и ежемес€чных данных.
ѕо завершении исследовани€ необходимо проверить, насколько каждый метод надежен и применим к рассматриваемой проблеме (табл.6).
3 ќпределить прогнозные значени€ с помощью четырехквартального скольз€щего среднего, простого экспоненциального сглаживани€, метода ’ольта, метода ¬интерса.
3.1 „етырехквартальное скольз€щее среднее.
ѕри использовании метода простых средних прогнозирование выполн€етс€ на основе усреднени€ всех существующих данных. ќднако, часто аналитика больше интересуют самые последние наблюдени€. “огда фиксируетс€ число точек данных, подлежащих усреднению, и ограничиваютс€ только последними наблюдени€ми. ƒл€ описани€ такой модели используетс€ термин скольз€щее среднее. ак только новое наблюдение становитс€ доступным, оно включаетс€ в усреднение, а наиболее старое соответственно исключаетс€. ¬ычисленное скольз€щее среднее используетс€ дл€ создани€ прогноза на следующий период.
“аблица 6 - –екомендации по выбору метода прогнозировани€*
| ћетод | ћодель данных | ¬ременна€ отдаленность | “ип модели | ћинимальные требовани€ к данным | |
| Ќесезонные | —езонные | ||||
| Ќаивный | ст, т, с | ¬– | |||
| ѕростые средние | ст | ¬– | |||
| —кольз€щие средние | ст | ¬– | 4-20 | ||
| Ёкспоненциальное сглаживание | ст | к | ¬– | ||
| Ћинейное экспоненциальное сглаживание | т | к | ¬– | ||
| вадратичное экспоненциальное сглаживание | т | к | ¬– | ||
| —езонное экспоненциальное сглаживание | с | к | ¬– | 2хс | |
| јдаптивна€ фильтраци€ | с | к | ¬– | 5хс | |
| ѕроста€ регресси€ | т | с | к | ||
| ћножественна€ регресси€ | ÷, — | с | к | 10х¬ | |
| лассическое разложение | с | к | ¬– | 5хс | |
| Ёкспоненциальные трендовые модели | т | с,д | ¬– | ||
| ћодели √омперца | т | с,д | ¬– | ||
| ¬озрастающие кривые | т | с,д | ¬– | ||
| ћодели Ѕокса-ƒженкинса | ст, т, ц, с | к | ¬– | 3хс | |
| ¬едущие индикаторы | ÷ | ||||
| Ёконометрические модели | ц | ||||
| ћногомерна€ регресси€ временного р€да | “, — | с,д | к | 6хс |
|
|
|
¬ажно, что в методике скольз€щего среднего используютс€ только последние k наблюдений и число точек, подлежащих усреднению, не мен€етс€ со временем. ћодель, построенна€ по данной методике, не очень хорошо учитывает тренд и сезонные вариации, хот€ делает это лучше, чем метод простого среднего.
ƒл€ анализа данных с помощью четырехквартального скольз€щего среднего:
- Ќа панели меню выбрать команду StatàTime Series à Moving Average
- ¬ открывшемс€ диалоговом окне (рисунок 7) выбрать р€д —1
- ƒл€ выбора четырехквартального скольз€щего среднего в поле MA Length ввести значение 4.
- ”становить флажок Generate Forecasts и ввести значение 1 в поле Number of forecasts.
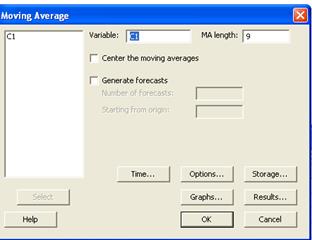
–ис. 7 ƒиалоговое окно Moving Average приложени€ Minitab for Windows
- Ќажать ќ .
–езультат анализа представлен на рисунке 8.
–ис. 8 –езультат четырехквартального скольз€щего среднего
3.2 ѕростое экспоненциальное сглаживание
ѕо сравнению с методами скольз€щих средних в методе простого экспоненциального сглаживани€ примен€етс€ взвешенное (экспоненциально) скольз€щее усреднение всех данных предыдущих наблюдений. Ёта модель чаще всего примен€етс€ к данным, о которых заранее не известно, имеют ли они тренд.
Ёкспоненциальное сглаживание предусматривает посто€нное обновление модели за счет наиболее свежих данных. Ётот метод основываетс€ на усреднении временных р€дов прошлых наблюдений в нисход€щем (экспоненциально) направлении. “.е. более поздним событи€м присваиваетс€ больший вес. ¬ес присваиваетс€ следующим образом: дл€ последнего наблюдени€ весом будет величина  (
( ), дл€ предпоследнего Ц (1- ), дл€ того, которое было перед ним, - (1- )2 и т.д.
¬ сглаженном виде новый прогноз будет определ€тьс€ как взвешенное среднее последнего наблюдени€ величины в момент времени t и ее прежнего прогноза на этот же период:

где  - прогнозируемое значение на следующий период;
 - посто€нна€ сглаживани€;
 - наблюдение величины за текущий период t;
 - прежний сглаженный прогноз этой величины на период t.
≈сли требуетс€, чтобы спрогнозированные величины были стабильны и случайные отклонени€ сглаживались, необходимо выбирать малое значение . Ѕольшее значение посто€нной имеет смысл в том случае, если нужна быстра€ реакци€ на изменени€ в спектре наблюдений. ƒл€ оценки оптимального значени€ можно минимизировать среднеквадратическую ошибку:
ѕри использовании основного уравнени€ простого экспоненциального сглаживани€ необходимо оговорить начальное сглаженное значение. „асто перва€ оценка устанавливаетс€ равной первому наблюдению. »ногда, в качестве начального используетс€ среднее значение первых п€ти или шести наблюдений.
—ледует отметить, что в методике экспоненциального сглаживани€ предполагаетс€, что данные колеблютс€ около уровн€, который мен€етс€ нечасто. огда же в данных присутствует значительный тренд, простое экспоненциальное сглаживание посто€нно отстает от реальных наблюдений. “огда необходимо использовать другие методы сглаживани€, представленные ниже.
|
|
|
ƒл€ анализа данных с помощью простого экспоненциального сглаживани€:
- Ќа панели меню выбрать команду StatàTime Series à Single Exp Smoothing
- ¬ открывшемс€ диалоговом окне (рисунок 9) выбрать р€д —1
- ¬ поле Weight to Use in smoothing.выберите значение Optimal Arima.
- ”становить флажок Generate Forecasts и ввести значение 1 в поле Number of forecasts.
- Ќажать ќ .
–езультат анализа представлен на рисунке 10.
3.3 ћетод ’ольта
¬ случае наличи€ тренда в исходных данных необходима функци€ прогнозировани€ линейного тренда. ¬ 1957 году ’ольт разработал метод экспоненциального сглаживани€, получивший название двухпараметрического метода ’ольта. ¬ этом методе учитываетс€ локальный линейный тренд, присутствующий во временных р€дах.

–ис. 9 ƒиалоговое окно Single Exponential Smoothing приложени€ Minitab for Windows

–ис. 10 –езультат простого экспоненциального сглаживани€
≈сли во временных р€дах имеетс€ тенденци€ к росту, то вместе с оценкой текущего уровн€ необходима и оценка наклона. ¬ методике ’ольта значени€ уровн€ и наклона сглаживаютс€ непосредственно, при этом используютс€ различные посто€нные сглаживани€ дл€ каждого из них. Ёти посто€нные сглаживани€ позвол€ют оценить текущий уровень и наклон, уточн€€ их вс€кий раз, когда по€вл€ютс€ новые наблюдени€. ќдним из преимуществ методики ’ольта €вл€етс€ ее гибкость, позвол€юща€ выбирать соотношение, в котором отслеживаютс€ уровень и наклон.
Ќиже приведены три уравнени€, составл€ющие метод ’ольта.
1 Ёкспоненциально сглаженный р€д или оценка текущего уровн€:

где  - нова€ сглаженна€ величина;
- посто€нна€ сглаживани€;
- новое наблюдение или реальное значение р€да в период t;
 - собственно оценка тренда;
2 ќценка тренда:

где  - посто€нна€ сглаживани€ (
 ).
).
3 ѕрогноз на р периодов вперед:

где  - прогноз на
  периодов вперед;
- количество периодов вперед, на которое делаетс€ прогноз.
ак и при обычном экспоненциальном сглаживании, посто€нные и выбираютс€ субъективно или путем минимизации ошибки прогнозировани€. „ем большие значени€ весов будут вз€ты, тем более быстрый отклик на происход€щие изменени€ будет иметь место. » наоборот, если веса будут небольшие, то и реакци€ модели на изменени€ в данных будет более слабой.
ƒл€ минимизации значений MSE нужно создать сетку значений и и выбрать ту комбинацию, котора€ даст меньшее значение MSE. ќсобый случай имеет место, когда = , поскольку здесь в одинаковой мере проводитс€ сглаживание как текущего уровн€ значений, так и тренда. “акой вариант называетс€ двойным экспоненциальным сглаживанием Ѕрауна.
ѕри использовании изложенного алгоритма также необходимо оговорить начальное сглаженное значение. „асто перва€ оценка устанавливаетс€ равной первому наблюдению. ѕри этом тренд будет равен нулю. »ногда, в качестве начального используетс€ среднее значение первых п€ти или шести наблюдений.
ƒл€ анализа данных с помощью метода ’ольта:
- Ќа панели меню выбрать команду StatàTime Series à Double Exp Smoothing
- ¬ открывшемс€ диалоговом окне (рисунок 11) выбрать р€д —1

–ис. 11 ƒиалоговое окно Double Exponential Smoothing приложени€ Minitab for Windows
- ¬ поле Weight to Use in smoothing.выберите значение Optimal Arima.
- ”становить флажок Generate Forecasts и ввести значение 1 в поле Number of forecasts/
- Ќажать ќ .
–езультат анализа представлен на рисунке 12.

–ис. 12 –езультат метода ’ольта дл€ прибыли предпри€ти€ ј
3.4 ћетод ¬интерса
≈сли в структуре данных присутствуют сезонные колебани€, то дл€ уменьшени€ ошибок прогнозировани€ примен€ют трехпараметрическую, линейную и сезонную модель экспоненциального сглаживани€, предложенную в 1960 году ¬интерсом. Ётот подход €вл€етс€ расширением метода ’ольта. ƒл€ учета сезонных колебаний здесь задействуетс€ дополнительное уравнение.
ћодель ¬интерса определ€етс€ следующими уравнени€ми:
1 Ёкспоненциально сглаженные р€ды:

2 ќценка тренда
3 ќценка сезонности:

где  - посто€нна€ сглаживани€ дл€ оценки сезонности.
4 ѕрогноз на р периодов вперед:

где  - длительность периода сезонного колебани€.
ак и в предыдущих методах, посто€нные , и выбираютс€ субъективно или путем минимизации ошибки прогнозировани€.
ћетод ¬интерса позвол€ет наиболее просто учесть в модели сезонность, если исходные данные имеют сезонную структуру. ¬ альтернативном способе предлагаетс€ сначала исключить сезонную составл€ющую или, наоборот, учесть сезонность в самих данных.
|
|
|
ƒл€ анализа данных с помощью метода ¬интерса:
- а) Ќа панели меню выбрать команду StatàTime Series à Winters Method
- б) ¬ открывшемс€ диалоговом окне (рисунок 13) выбрать р€д —1
- в) ¬ поле Seasonal length ввести значение 4 (период сезонных колебаний)
- г) ¬ поле Weight to Use in smoothing.выберите значени€, представленные на рисунке 13.
- д) ”становить флажок Generate Forecasts и ввести значение 1 в поле Number of forecasts.
- е) Ќажать ќ .

–ис. 13 ƒиалоговое окно Winters Method приложени€ Minitab for Windows
–езультат анализа представлен на рисунке 14.
4 ƒекомпозици€ временного р€да
ќдин из методов анализа временных р€дов включает попытку определить составл€ющие факторы, которые вли€ют на каждое значение временного р€да. ѕодобна€ процедура идентификации называетс€ декомпозицией. ажда€ компонента идентифицируетс€ отдельно. «атем вклады каждой компоненты комбинируютс€ с целью получени€ прогнозов будущих значений временных р€дов.
ћетоды декомпозиции используютс€ как дл€ кратковременных, так и дл€ долговременных прогнозов. — их помощью также можно просто отображать рост или спад, лежащий в основе тренда, или корректировать значени€ р€да, исключа€ из них одну или несколько компонент.

–ис. 14 –езультат метода ¬интерса дл€ прибыли предпри€ти€ ј
Ќедостатком данного метода €вл€етс€ то, что проекци€ отдельных компонент на будущее с последующей их комбинацией дл€ получени€ прогноза значений основного р€да на практике не всегда работает достаточно хорошо. “рудность заключаетс€ в том, что сложно дать точный прогноз дл€ отдельных компонент. –азработка более гибких модельных процедур прогнозировани€ сделала декомпозицию больше инструментом анализа и понимани€ временных р€дов, чем самосто€тельным методом прогнозировани€.
¬ременной р€д можно разложить на следующие компоненты:
1 “ренд (“) Ц компонента, характеризующа€ основной рост (или спад) во временном р€ду.
2 ÷икличность (—) Ц последовательность волнообразующих флуктуаций или циклы длительностью более одного года. Ќа практике цикл идентифицировать сложно, в этом случае основной рост (или спад) называют трендово-циклическим.
3 —езонность (S). —езонные изменени€ обычно присутствуют в квартальных, мес€чных или недельных данных. ѕод сезонными вариаци€ми понимают изменени€ с более или менее стабильной структурой, имеющие годовую цикличность.
4 Ќерегул€рность (I). Ќерегул€рна€ компонента включает непредсказуемые или случайные флуктуации.
ƒл€ изучени€ компонент временных р€дов аналитик должен рассмотреть, как кажда€ из них св€зана с реальным р€дом. Ёта задача решаетс€ посредством задани€ модели, в которой переменна€ временного р€да Y выражаетс€ в терминах его компонент “, —, S и I.
ƒвум€ простейшими модел€ми €вл€ютс€:
јддитивна€:
Y=T+C+S+I
ћультипликативна€:
Y=T*C*S*I
ћодель аддитивных компонент примен€етс€ в тех случа€х, когда анализируемый временной р€д имеет приблизительно одинаковые изменени€ на прот€жении всей длительности р€да. »ными словами, все значени€ р€да существенно убывают в пределах полосы посто€нной ширины, центрированной на уровне тренда.
ћодель мультипликативных компонент эффективнее в тех случа€х, когда изменение временной последовательности увеличиваетс€ с ростом уровн€, т.е. значени€ р€да расход€тс€ как имеющие тренд, а наблюдаема€ последовательность значений напоминает рупор или воронку.
“ренд представл€ет собой долговременные изменени€ во временных р€дах, которые иногда можно описать с помощью пр€мой линии или гладкой кривой.
ƒл€ деловых и экономических временных р€дов следует рассматривать трендовую (трендово-циклическую) компоненту как гладкое изменение во времни. ¬ действительности тренд редко можно описать такой простой функцией как пр€ма€ лини€.
ривую тренда временного р€да необходимо сглаживать по двум причинам. ¬о-первых, это позвол€ет исследовать основное направление р€да, во-вторых, можно исключить вли€ние тренда из первоначального р€да с целью получени€ более отчетливой картины сезонности.
¬ременное уравнение дл€ тренда может быть применено к данным на основе метода наименьших квадратов.
—езонна€ структура имеет место при наличие €влений, повтор€ющихс€ из года в год. Ќа годичных данных сезонность никак не отражаетс€, поскольку нет возможности смоделировать внутригодовую структуру данных, значени€ которых регистрируютс€ лишь один раз в год. ќднако во временных р€дах, содержащих недельные, мес€чные или квартальные наблюдени€, сезонность про€вл€етс€ очень часто.
—уществует несколько методов дл€ оценки сезонных вариаций. ќсновна€ иде€ всех этих методов заключаетс€ в том, что в реальном р€ду сначала оцениваетс€ и убираетс€ тренд, а потом сглаживаетс€ возможна€ нерегул€рна€ компонента. ћожно считать, что оставшиес€ данные будут содержать только сезонные вариации. —езонные величины собираютс€ и суммируютс€ дл€ получени€ числа (числового индекса) дл€ каждого наблюдаемого интервала года (недели, мес€ца, квартали и т.д.).
“аким образом, определение сезонной компоненты во временном р€ду отличаетс€ от анализа тренда в двух отношени€х.
1 “ренд определ€етс€ непосредственно из начальных данных, а сезонна€ компонента вычисл€етс€ лишь после исключени€ из набора данных всех остальных компонент, в результате чего в них остаетс€ только сезонность.
2 “ренд описываетс€ с помощью одной кривой или одного уравнени€, а в случае сезонности отдельное значение рассчитываетс€ дл€ каждого наблюдаемого интервала года и чаще всего имеет вид числового индекса.
—езонна€ структура про€вл€етс€ в сезонных (числовых) индексах. „исловые индексы €вл€ютс€ удельными величинами, характеризующими изменени€ величины во времени.
ƒл€ мес€чных данных, например, сезонный индекс 1.0 дл€ одного мес€ца означает, что ожидаемое значение дл€ него составл€ет 1/12 от общего значени€ дл€ всего года. «начение индекса 1,25 дл€ другого мес€ца подразумевает, что ожидаемые наблюдени€ дл€ него превыс€т на 25% 1/12 годичного целого, и т.д. „исловые индексы указывают на ожидаемые подъемы и спады уровн€ активности в течение года после того, как трендова€ и нерегул€рна€ компонента были удалены.
„тобы выделить сезонность, нужно в первую очередь оценить и удалить тренд. “ренд можно оценить с помощью одной из кривых тренда или метода скольз€щих средних.
ѕри использовании модели мультипликативной декомпозиции существует попул€рный метод оценки сезонных вариаций, называемый отнесение к скольз€щему среднему. ¬ этом методе тренд оцениваетс€ с использованием центрированного скольз€щего среднего.
≈сли сезонна€ структура претерпевает изменени€, то оценка сезонной компоненты на полном наборе данных может дать ошибочные результаты. ¬ этом случае дл€ оценки сезонной компоненты лучше использовать либо только самые свежие данные, либо модель временных р€дов, допускающую выделение сезонности.
ѕосле определени€ сезонной компоненты ее можно использовать дл€ вычислени€ данных с устраненными сезонными колебани€ми. ƒл€ аддитивной декомпозиции такие данные вычисл€ютс€ путем вычитани€ сезонной компоненты из исходных значений.

ƒл€ мультипликативной декомпозиции данные с устраненными сезонными колебани€ми вычисл€ютс€ путем делени€ исходных данных на сезонную компоненту.

¬ыдел€ют три мотива дл€ выполнени€ сезонной корректировки данных:
1 »сключение сезонности позвол€ет достоверно сравнивать значени€ в различные моменты времени.
2 —оотношение между экономическими переменными легче пон€ть, ели осложн€ющий фактор сезонности предварительно устранен из данных.
3 »сключение сезонности может быть полезным элементом в получении кратковременных прогнозов будущих значений данных временных р€дов.
÷иклы Ц это долговременные волнообразные колебани€, которые чаще всего встречаютс€ в макропоказател€х экономической де€тельности. ¬ тех пределах, в которых они могут быть измерены, циклы обычно не имеют устойчивой структуры. ќднако определенное понимание циклического поведени€ временных р€дов может быть получено путем исключени€ из них трендовой и сезонной компонент с использованием метода мультипликативной декомпозиции:

ƒл€ сглаживани€ нерегул€рностей можно использовать скольз€щее среднее, сохран€€ в данных лишь циклическую компоненту. „тобы исключить проблему центрировани€ при использовании метода скольз€щего среднего с четными временными периодами, нерегул€рности сглаживаютс€ по методу скольз€щего среднего с нечетным количеством периодов (дл€ мес€чных данных 5,7,9,11, дл€ квартальных данных - 3).
Ќаконец, нерегул€рна€ компонента оцениваетс€ с помощью следующего уравнени€:

Ќерегул€рна€ компонента описывает вариабельность во временных р€дах после того, как были удалены все остальные компоненты. »ногда ее также называют остатком или ошибкой. ѕри мультипликативной декомпозиции как циклическа€, так и нерегул€рна€ компоненты выражаютс€ индексами.
≈динственна€ причина выполнени€ декомпозиции временной последовательности состоит в стремлении выделить и рассмотреть отдельные компоненты последовательности. ѕосле того как аналитик рассмотрит трендовую, сезонную, циклическую и нерегул€рную компоненты по отдельности, можно попытатьс€ проникнуть в суть структуры исходных данных. роме того, выделенные компоненты можно заново комбинировать с целью получени€ прогнозов будущих значений временных р€дов.
ќдним из путей исследовани€ циклической структуры €вл€етс€ изучение деловых показателей. ƒеловой показатель представл€ет собой св€занный с деловой активностью временной р€д, предназначенный дл€ оценки общего состо€ни€ экономики, в частности по отношению к бизнес-циклу.
¬ прогнозировании сезонных временных р€дов используетс€ процесс, обратный декомпозиции. –ослее разбиени€ р€да на отдельные компоненты дл€ их раздельного изучени€, его компоненты собираютс€ дл€ построени€ прогноза на будущие периоды.
ћетоды декомпозиции временных р€дов имеют длинную историю. ¬ 1920-х и начале 1930-х годов в ‘едеральном резервном управлении и Ќациональном комитете экономи≠ческих исследований —Ўј проводились интенсивные исследовани€ в области сезонных корректировок и методов сглаживани€ экономических временных р€дов. ќднако пока компьютерна€ техника не получила необходимого развити€, декомпозиционные вычислени€ были трудоемкими и практическое применение этих методов было ограничено. ¬ начале 1950-х годов ƒжулиус Ўискин (Julius Shiskin), руководитель группы экономических статистиков в Ѕюро переписи населени€ —Ўј, разработал масштабную компьютерную программу дл€ декомпозиции временных р€дов. ѕерва€ компьютерна€ программа весьма приближенно соответствовала ручному методу, что было пределом возможностей на то врем€, и поэтому годом позже ее заменили на усовершенствованную програм≠му, известную как Method II. ƒалее последовала сери€ усовершенствованных вариантов этой программы. “екущий вариант программы декомпозиции временного р€да Ѕюро пе≠реписи населени€ известен как X-12-ARIMA.
ƒекомпозици€ по методу Census II обычно €вл€етс€ мультипликативной, поскольку большинство экономических временных р€дов имеет сезонные вариации, которые увеличиваютс€ с ростом уровн€ р€да. роме того, этот метод декомпозиции предполагает использование трех компонент: трендово-циклической, сезонной и нерегул€рной.
ћетод Census II включает выполнение последовательности этапов, повтор€ющихс€ до тех пор, пока компоненты не будут успешно разделены. Ќа большинстве этапов к данным примен€етс€ метод взвешенного скольз€щего среднего, что приводит к неминуемой утрате данных в результате усреднени€ в начале и в конце последовательности. ѕрограмма ARIMA, часть пакета X-12-ARIMA, позвол€ет расширить при прогнозировании исходный р€д в обоих направлени€х, поэтому большинство наблюдений подгон€етс€ с использованием полного взвешенного скольз€щего среднего.
Ётапы, выполн€емые на каждой итерации метода Census II, реализованного в программном пакете X-12-ARIMA, описываютс€ ниже. »з-за большого количества этапов метод может показатьс€ слишком сложным. ќднако основна€ его иде€ очень проста Ч отделить трендово-циклическую, сезонную и нерегул€рную компоненты друг от друга. Ќаличие множества итераций лишь улучшает оценку каждой компоненты.
Ётап 1. „тобы получить грубую оценку трендово-циклической компоненты, к исходным данным примен€етс€ метод s-периодического скольз€щего среднего. (ƒл€ мес€чных данных s=12, дл€ квартальных данных s = 4 и т.д.)
Ётап 2. ќтношени€ исходных данных к этим значени€м скольз€щего среднего вычисл€ютс€ по методу классической мультипликативной декомпозиции.
Ётап 3. ѕолученные на втором этапе отношени€ содержат как сезонную компоненту, так и нерегул€рную. ¬ них также вход€т экстремальные значени€, €вл€ющиес€ результатом необычных событий, таких как забастовки или войны. ¬ычисленные отношени€ дел€тс€ на грубую оценку сезонной компоненты, что в результате дает оценку нерегул€рной компоненты. Ѕольшие значени€ нерегул€рной компоненты указывают на экстремальные величины в исходных данных. ѕодобные экстремальные величины вы€вл€ютс€, и полученные на втором этапе отношени€ соответствующим образом подгон€ютс€. “акой подход эффективно исключает те значени€, которые не соответствуют общей структуре всех остальных данных. Ќедостающие значени€ в начале и в конце последовательности также замен€ютс€ на оценки, полученные на этом этапе.
Ётап 4. ќтношени€, полученные из модифицированных данных (с исключенными экстремальными величинами и оценками дл€ недостающих значений), сглаживаютс€ по методу скольз€щего среднего с целью исключени€ нерегул€рных изменений. ¬ результате будет получена предварительна€ оценка сезонной компоненты.
Ётап 5. »сходные данные дел€тс€ на предварительную оценку сезонной компоненты, полученную на четвертом этапе, что дает предварительные р€ды с сезонной коррекцией. Ёти р€ды с сезонной коррекцией включают трендово-циклическую и нерегул€рную компоненты:

Ётап 6. “рендово-циклическа€ компонента оцениваетс€ посредством применени€ метода взвешенного скольз€щего среднего к предварительному р€ду с коррекцией сезонных колебаний. —кольз€щее среднее устран€ет нерегул€рные изменени€ и дает гладкую кривую, котора€ демонстрирует предварительную оценку трендово-циклической компоненты в данных.
Ётап 7. ƒалее повтор€етс€ выполнение второго этапа, но уже с новыми оценками трендово-циклической компоненты. »ными словами, новые отношени€, содержащие только сезонную и нерегул€рную компоненты, будут получены посредством делени€ исходных наблюдений на значени€ трендово-циклической компоненты, рассчитанные на этапе 6. ¬ результате будут получены оконча≠тельные значени€ сезонно-нерегул€рных отношений:

Ётап 8. ѕовтор€етс€ выполнение третьего этапа, но уже с использованием новых отношений, вычисленных на седьмом этапе.
Ётап 9. ѕовтор€етс€ выполнение четвертого этапа, что дает новую оценку сезонной компоненты.
Ётап 10. ¬ыполн€ютс€ действи€ п€того этапа с использованием оценки сезонной компоненты, полученной на дев€том этапе.
Ётап 11. ƒанные с сезонной коррекцией из дес€того этапа дел€тс€ на значени€ трендово-циклической компоненты, полученные на шестом этапе, что в результате дает оценку нерегул€рной компоненты.
Ётап 12. Ёкстремальные значени€ нерегул€рной компоненты исключаютс€ по методу, описанному на третьем этапе. –€ды модифицированных данных получаютс€ путем перемножени€ значений трендово-циклической, сезонной и подогнанной нерегул€рной компонент. Ёти данные соответствуют исходным данным, за исключением удаленных экстремальных значений.
«атем все эти двенадцать этапов повтор€ютс€, причем вместо исходных данных используютс€ модифицированные данные из двенадцатого этапа. ¬ некоторых случа€х диапазон скольз€щих средних может быть изменен в зависимости от вариабельности данных.
ќкончательный р€д с исключенными сезонными колебани€ми определ€етс€ посредством делени€ исходных данных на окончательную сезонную компоненту. –езультат содержит только произведение трендово-циклической и нерегул€рной компонент.
«начени€ каждой из финальных компонент распечатываютс€, и по ним стро€тс€ гра≠фики. —уществует р€д диагностических тестов, с помощью которых можно определить, насколько удачной оказалась выполненна€ декомпозици€.
ѕрограммный пакет X-12-AR1MA включает множество дополнительных возможно≠стей, которые не были описаны. Ќапример, можно делать корректировку дл€ различного числа операционных дней в мес€цах и дл€ учета эффекта праздников. ћожно оценить и добавить недостающие значени€ р€да, можно до начала декомпозиции удалить нетипичные эффекты, можно смоделировать другие изменени€ в тренде, такие как эффекты сдвига уровн€ или временных уклонов.
ƒл€ прогнозировани€ с помощью уравнений тренда:
а) ƒл€ запуска процедуры анализа тренда выбрать команду StatàTime SeriesàTrend Analysis
б) Ќа экране раскроетс€ диалоговое окно Trend Analysis (јнализ тренда) (рис.15).
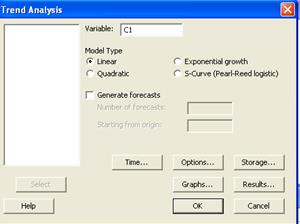
–ис.15 ƒиалоговое окно Trend Analysis в Minitab for Windows
в) ¬ открывшемс€ диалоговом окне необходимо выполнить следующее:
- в качестве значени€ пол€ Variable (ѕеременна€) указать C1;
- переключатель Model Type (“ип модели) позвол€ет выбирать тип модели тренда.
- установить флажок опции Generate forecasts (√енерировать прогнозы) и ввести значение 1 в поле Number of forecasts ( оличество прогнозов), чтобы сделать прогноз на 1 квартал
- в поле Title («аголовок) введите заголовок.
- щелкнуть на кнопке ќ , и на экран будет выведен график.
г) ѕовторить п.в) дл€ прочих моделей тренда.
ƒл€ декомпозиции временного р€да:
а) ¬вести в столбец —1 сведени€ о прибыли предпри€ти€. ƒл€ расчета декомпозиционной модели выбрать команду StatàTime SeriesàDecomposition.
б) Ќа экране раскроетс€ диалоговое окно Decomposition (ƒекомпозици€), показанное на рис. 16.

–ис. 16. ƒиалоговое окно Decomposition приложени€ Minitab
- в поле Variable (ѕеременна€) ввести значение —1
- поскольку данные €вл€ютс€ квартальными, в поле Seasonal Length (ƒлительность сезонного цикла) ввести значение 4
- переключатель Model Type (“ип модели) установить в положение Multiplicative (ћультипликативна€), а переключатель Model Components ( омпоненты модели) Ч в положение Trend plus seasonal (“ренд плюс сезонность)
- в поле Fist obs. is in seasonal period (—езонный период первого наблюдени€) ввести значение 1
- установить флажок опции Generate forecasts и ввести значение 4 в поле Number of forecasts
в) ўелкнуть на кнопке Storage... (—охранение), и на экране раскроетс€ диалоговое окно Decomposition - Storage, показанное на рис. 17.

Puc. 17. ƒиалоговое окно Decomposition - Storage приложени€ Minitab
- в группе Storage установить флажки опций Trend Line (Ћини€ тренда), Detrended data (ƒанные с исключенным трендом), Seasonals (—езонные колебани€), Seasonally adjusted data (ƒанные с исключенными сезонными колебани€ми)
- щелкнуть на кнопке ќ в этом диалоговом окне, а затем в диалоговом окне Decomposition. –езультат представлен в табл. 7.
“аблица 7 Ц ‘рагмент мультипликативной декомпозиции данных о квартальной прибыли
| Y | TREN1 | DETR1 | SEAS1 | DESE1 |
| ‘актические данные | ќценка тренда | ƒанные с исключенным трендом | —езонные колебани€ | ƒанные с исключенными сезонными колебани€ми |
| 100,5 | 274,9532 | 0,365517 | 0,6769 | 148,4709 |
| 205,5 | 273,8682 | 0,750361 | 1,032843 | 198,9654 |
| 258,8 | 272,7831 | 0,948739 | 1,165822 | 221,9892 |
| 271,6981 | 0,909097 | 1,124435 | 219,666 | |
| 128,8 | 270,6131 | 0,475956 | 0,6769 | 190,2792 |
| Е | Е | Е | Е | Е |
| 294,2 | 232,6365 | 1,264634 | 1,124435 | 261,6426 |
| 188,1 | 231,5515 | 0,812346 | 0,6769 | 277,8844 |
| 241,6 | 230,4665 | 1,048309 | 1,032843 | 233,9174 |
| 229,3814 | 1,076809 | 1,165822 | 211,8676 | |
| 237,4 | 228,2964 | 1,039876 | 1,124435 | 211,1283 |
г) Ќа экран будут выведены диалоговые окна и графики, представленные на рис. 18-19.
| Time Series Decomposition for Y Fitted Trend Equation Yt = 276,0 - 1,08504*t Seasonal Indices Period Index 1 0,67690 2 1,03284 3 1,16582 4 1,12443 Accuracy Measures MAPE 17,36 MAD 41,37 MSD 2674,04 Forecasts Period Forecast 45 153,799 46 233,553 47 262,358 48 251,824 |
–ис.18 Ћистинг результатов декомпозиции данных в Minitab for Windows
Ќа левом верхнем графике представлены исходные данные, на правом Ц данные с исключенным трендом (индекс). Ќа левом нижнем графике представлены данные с устраненными сезонными колебани€ми, на правом Ц данные с устраненным трендом и сезонностью.

–ис. 19. јнализ компонент данных

–ис. 20 —езонный анализ данных о квартальной прибыли предпри€ти€
Ќа рис. 20 представлены следующие сезонные компоненты.
ѕервый квартал = 0,6769à67,6%
¬торой квартал = 1,0328à103,3%
“ретий квартал = 1,1658à116,6%
„етвертый квартал = 1,1244à112,4%
¬ерхн€€ лева€ диаграмма на рис. 20 представл€ет сезонные компоненты, отнесенные к 1,0. ћожно видеть, что прибыль в первом квартале на 32,4% ниже средних, во втором квартале она приблизительно така€, как и ожидалось, в третьем квартале прибыль почти на 17% выше средней, а в четвертом квартале почти на 13% превышает обычные значени€.
Ќа правом верхнем графике представленные данные с исключенными сезонными колебани€ми по периодам (кварталам). ¬ левом нижнем углу представлено процентное отклонение за период сезонности, в правом Ц остатки за период сезонности.
5 ¬ыбор метода прогнозировани€ можно осуществить на основе минимальной среднеквадратической ошибки (MSD).

