


Ћабораторна€ работа є2
> restart:
¬еро€тность попадани€ стрелком в дес€тку равна 0,7, а в дев€тку - 0,3. ќпределить веро€тность того, что данный стрелок при трех выстрелах наберет не менее 29 очков.
P1 - событие, состо€щее в том, что при первом выстреле попадет в 10
P2 - событие, состо€щее в том, что при втором выстреле попадет в 10
P3 - событие, состо€щее в том, что при третьем выстреле попадет в 10
P=P1*P2*P3+(-P1)*P2*P3+ј1*(-P2)*P3+P1*P2*(-P3)
> P:=0.7*0.7*0.7+0.3*0.7*0.7+0.7*0.3*0.7+0.7*0.7*0.3;

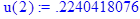
2.¬еро€тность попадани€ в дес€тку при одном выстреле p=0.2. —колько нужно произвести независимых выстрелов, чтобы с веро€тностью не менее 0,9 попасть в дес€тку хот€ бы один раз?
> P1:=1-0.9:
> P2:=1-0.2:
> p:=ln(P1)/ln(P2);

3.Ѕросаютс€ дес€ть правильных игральных костей. Ќайти веро€тности выпадени€:
ј) хот€ бы одной единицы;
> P_a:=1-(5/6)^10:
> evalf(P_a);

Ѕ) ровно одной единицы.
> P_b:=binomial(10,1)* 0.5^1 * 0.5^9:
> evalf(P_b);

4.¬ среднем левши составл€ют 1%. Ќайти шансы на то, что среди 200 случайно выбранных людей окажетс€:
ј) ровно четверо левшей;
> P_a:=binomial(200,4)* 0.01^4 * 0.99^196;

Ѕ) ровно дес€ть левшей.
> P_b:=binomial(200,10)* 0.01^10 * 0.99^190;

5. ¬ задаче Ѕанаха о спичечных коробках найти веро€тности Ur при r=0,1,2...30 и N=50.
> N:=50:
> for r from 0 to 30 do
U(r):=evalf(binomial(2*N-r,N)*(1/2^(2*N-r)))
End do;


нига в 500 страниц содержит 500 опечаток. »спользу€ приближенную формулу ѕуассона, найти веро€тность того, что на странице содержитс€ не менее трех опечаток.
> str:=1:
> P_1:=(str^0*exp(-1))/0!+(str^1*exp(-1))/1!+(str^2*exp(-1))/2!:
> P:=1-P_1:
> evalf(P);

7.—пециализированна€ Ё¬ћ содержит 10000 элементов. ¬еро€тность отказа одного элемента в течение одного года работы равна 0,00001 и не зависит от состо€ни€ других элементов. Ќайти веро€тность отказа за год:
ј) ровно двух элементов;
> P:=binomial(10000,2)*(0.00001^2)*(0.99999^9998);

б) не менее двух элементов.
> P_q:=10000*0.00001;

> P_qq:=((P_q^0)*exp(-P_q))/0!+((P_q^1)*exp(-P_q))/1!;

> P:=1-P_qq;

8.“елефонна€ станци€ обслуживает 3000 абонентов. ¬еро€тность того, что любой ее абонент позвонит в течение часа, равна 0,001. Ќайти веро€тности, что в течение часа позвон€т k=0,1,2,...,10 абонентов.
> p:=3000*0.001;

> for k from 0 to 10 do
> u(k):=evalf(((p^k)*exp(-p))/k!)
> end do;


9.»зобразить многоугольники следующих распределений одномерной дискретной случайной величины:
а) биномиального при n=10,p=0.1,k=0,1,2...10;
> n:=10:
> p:=0.1:
> plot([seq([k,stats[statevalf,pf,binomiald[n,p]](k)],k=0..10)]);
|
|
|

б) ѕуассона при l=0.5 и l=1,k=0,1,2,...10;
> l:=0.5:
> k:=0..10:
> plot([seq([k,stats[statevalf,pf,poisson[l]](k)],k=0..10)]);
> l:=1:
> k:=0..10:
> plot([seq([k,stats[statevalf,pf,poisson[l]](k)],k=0..10)]);

в) гипергеометрического при n1=n2=10,r=5,k=0,1,2,...10;
> N1:=10:
> N2:=10:
> r:=5:
> k:=0..10:
> plot([seq([k,stats[statevalf,pf,hypergeometric[N1, N2, r]](k)],k=0..10)]);

г) отрицательного биномиального при r=5,p=0.5,k=0,1,2,...10.
> r:=5:
> p:=0.5:
> k:=0..10:
> plot([seq([k,stats[statevalf,pf,negativebinomial[r,p]](k)],k=0..10)]);

> with(stats):
Warning, these names have been redefined: anova, describe, fit, importdata, random, statevalf, statplots, transform
10. »зобразить на одном графике семейства функций плотности (функций распределени€) дл€ следующих случаев:
а) равномерное распределение с параметрами a=1, b=5; a=-3,b=-1;
Warning, these names have been redefined: anova, describe, fit, importdata, random, statevalf, statplots, transform
> plot(statevalf[pdf,discreteuniform[1,5]],colour=green);
Plotting error, empty plot
>
>
б) нормальное распределение при следующих значени€х параметров:m=0, q=1; m=0,q=3; m=0,q=10; -4<=x<=4;m=2,q=1;m=2,q=3;m=2,q=10; -2<=x<=6
в) показательное распределение при следующих значени€х параметра: a=0.5,a=1,a=2,0<=x<=5;
г) распределение оши при следующих значени€х параметра:t=0.5,t=1,t=2,-5<=x<=5;
>
д) распределение хи-квадрат при следующих значени€х параметра: m=1,m=2,m=3,-5<=x<=5;
>
е) распределение —тьюдента при следующих значени€х параметра: k=1,k=2,k=3,-5<=x<=5.
>
11.ѕровести генерацию случайных последовательностей из 30 чисел, использу€ следующие распределени€:a) равномерное,б) нормальное,в) показательное,г) оши, д) хи - квадрат, е) —тьюдента, ж) ѕуассона. ѕараметры этих распределений выбрать самосто€тельно.
A)
> stats[random,uniform](30);

Ѕ)
> stats[random,normald](30);


¬)
> stats[random,exponential[3,9]](30);

√)
> stats[random,cauchy[3,9]](30);

ƒ)
> stats[random,chisquare[3]](30);

≈)
> stats[random,studentst[3]](30);

∆)
> stats[random,poisson[3]](30);


