


–есурс PhysioNet
PhysioNet предлагает свободный веб-доступ к большому количеству зарегистрированных физиологических сигналов (PhysioBank) и общедоступному программное обеспечению (PhysioToolkit). ≈жемес€чно около 45000 посетителей во всем мире используют PhysioNet.
PhysioBank в насто€щее врем€ содержит более чем 36000 аннотируемых записей, переведенных в цифровую форму. Ёто физиологические сигналы и временные р€ды, организованные в более чем 50 базах данных (коллекци€х записей). ќбъем данных составл€ет около 4 терабайт. ¬се данные наход€тс€ в свободном доступе.
ак работать с ј“ћ PhysioBank
PhysioBank's Automated Teller Machine Ц средство самосто€тельного изучени€ PhysioBank, использу€ ¬аш web-браузер. ¬ насто€щее врем€ его комплект инструментов Toolbox включает программное обеспечение, которое может показать графики сигналов, графики распределени€ RR интервалов, гистограммы распределени€ RR интервалов, преобразовать файлы сигнала WFDB в текст, CSV, EDF или.mat файлы (дл€ использовани€ с Matlab).
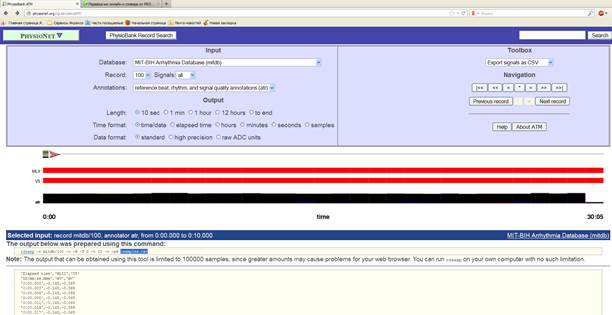
«айти на сайт ј“ћ PhysioBank http://physionet.org/cgi-bin/ATM, там можно искать или выбирать и копировать данные из PhysioBank, выбрать нужную базу данных, запись и временной интервал

¬ окне DateBase выбрать базу данных (их более 70), в окне Record выбрать запись, в окне Signals выбрать все отведени€ (или конкретное отведение).
¬ окне Length выбрать длительность представленного участка сигнала (10 sec, 1 min, 1 hour, 12 hours, to end), в окне Time format: установить временной формат, в окне Data format установить формат данных.
ƒл€ вывода графика сигнала (Ё —) в окне Toolbox выбрать Plot wavefoprm.

роме того, Toolbox позвол€ет:
Ј построить график распределени€ RR интервалов (Plot RR intervals)

Ј гистограмму распределени€ RR интервалов (Plot RR histograms)

Ј показать участок сигнала в текстовом формате (Show samples as text)
Elapsed time MLII V1 hh:mm:ss.mmm (mV) (mV) 0:00.000 -2.045 -1.245 0:00.003 -2.045 -1.245 0:00.006 -2.045 -1.245 0:00.008 -2.045 -1.245 0:00.011 -2.045 -1.245 0:00.014 -2.090 -1.245 0:00.017 -2.140 -1.245 0:00.019 -2.205 -1.345 0:00.022 -2.270 -1.445 0:00.025 -2.340 -1.575 0:00.028 -2.405 -1.720 0:00.031 -2.465 -1.830 0:00.033 -2.545 -1.830 0:00.036 -2.580 -1.715 0:00.039 -2.555 -1.515 0:00.042 -2.435 -1.310 0:00.044 -2.220 -1.095 0:00.047 -1.940 -0.910 0:00.050 -1.640 -0.780 0:00.053 -1.425 -0.690 0:00.056 -1.215 -0.605 0:00.058 -1.050 -0.480 0:00.061 -0.935 -0.355 0:00.064 -0.840 -0.210 0:00.067 -0.780 -0.095 0:00.069 -0.720 -0.015 0:00.072 -0.690 0.045 0:00.075 -0.640 0.105 0:00.078 -0.595 0.150 0:00.081 -0.570 0.215 0:00.083 -0.540 0.290 0:00.086 -0.500 0.340
Ј показать аннотацию в текстовом формате (Show annotation as text)
Time Sample # Type Sub Chan Num Aux 0:00.131 47 + 0 0 0 (P 0:00.264 95 / 0 0 0 0:00.756 272 / 0 0 0 0:01.581 569 / 0 0 0 0:02.456 884 / 0 0 0 0:03.350 1206 / 0 0 0 0:04.219 1519 / 0 0 0 0:05.056 1820 / 0 0 0 0:05.883 2118 / 0 0 0 0:06.706 2414 / 0 0 0 0:07.558 2721 / 0 0 0 0:08.425 3033 / 0 0 0 0:09.297 3347 / 0 0 0
|
|
|
Ј показать длительности RR интервалов в текстовом формате (Show RR intervals as text)
t0 b0 RR (sec) b1 t1
0:00.000 [0] 0.264 / 0:00.264 0:00.264 / 0.492 / 0:00.756 0:00.756 / 0.825 / 0:01.581 0:01.581 / 0.875 / 0:02.456 0:02.456 / 0.894 / 0:03.350 0:03.350 / 0.869 / 0:04.219 0:04.219 / 0.836 / 0:05.056 0:05.056 / 0.828 / 0:05.883 0:05.883 / 0.822 / 0:06.706 0:06.706 / 0.853 / 0:07.558 0:07.558 / 0.867 / 0:08.425 0:08.425 / 0.872 / 0:09.297Ј показать описание записи (Describe record) Record mitdb/107Notes===== 63 M 1340 167 x1 Digoxin Complete heart block is present. The PVCs are multiform.=====Starting time: not specifiedLength: 30:05.556 (650000 sample intervals)Sampling frequency: 360 Hz2 signalsGroup 0, Signal 0: File: 107.dat Description: MLII Gain: 200 adu/mV Initial value: 615 Storage format: 212 I/O: can be unbuffered ADC resolution: 11 bits ADC zero: 1024 Baseline: 1024 Checksum: -15266Group 0, Signal 1: File: 107.dat Description: V1 Gain: 200 adu/mV Initial value: 775 Storage format: 212 I/O: can be unbuffered ADC resolution: 11 bits ADC zero: 1024 Baseline: 1024 Checksum: -14885 Ј экспортировать сигнал как SCV (Export signals as SCV) CSV Ц Comma-Separated Values Ч значени€, разделЄнные зап€тыми) Ц текстовый формат, предназначенный дл€ представлени€ табличных данных. ажда€ строка файла Ц это одна строка таблицы. «начени€ отдельных колонок раздел€ютс€ разделительным символом (delimiter) Ч зап€той (,). »менно в таком формате удобно экспортировать в Excel и далее в LabVIEW 'Elapsed time','MLII','V1''hh:mm:ss.mmm','mV','mV''0:00.000',-2.045,-1.245'0:00.003',-2.045,-1.245'0:00.006',-2.045,-1.245'0:00.008',-2.045,-1.245'0:00.011',-2.045,-1.245'0:00.014',-2.090,-1.245'0:00.017',-2.140,-1.245'0:00.019',-2.205,-1.345'0:00.022',-2.270,-1.445'0:00.025',-2.340,-1.575'0:00.028',-2.405,-1.720'0:00.031',-2.465,-1.830'0:00.033',-2.545,-1.830'0:00.036',-2.580,-1.715'0:00.039',-2.555,-1.515'0:00.042',-2.435,-1.310'0:00.044',-2.220,-1.095'0:00.047',-1.940,-0.910'0:00.050',-1.640,-0.780'0:00.053',-1.425,-0.690'0:00.056',-1.215,-0.605'0:00.058',-1.050,-0.480'0:00.061',-0.935,-0.355'0:00.064',-0.840,-0.210'0:00.067',-0.780,-0.095'0:00.069',-0.720,-0.015'0:00.072',-0.690,0.045'0:00.075',-0.640,0.105'0:00.078',-0.595,0.150'0:00.081',-0.570,0.215'0:00.083',-0.540,0.290'0:00.086',-0.500,0.340'0:00.089',-0.480,0.380'0:00.092',-0.450,0.415'0:00.094',-0.395,0.440'0:00.097',-0.325,0.480'0:00.100',-0.250,0.515'0:00.103',-0.200,0.550'0:00.106',-0.165,0.570'0:00.108',-0.140,0.600
Ј экспортировать сигнал как EDF (Export signals as EDF) EDF Ц European Data Format (EDF) - простой и гибкий формат дл€ обмена и хранени€ многоканальных биологических и физических сигналов.
ѕодробна€ информаци€ о формате EDF http://www.edfplus.info/specs/index.html
Ј экспортировать сигнал как.mat (Export signals as.mat) дл€ работы с сигналами в Matlab
Ј (Make tarball of record)
Ј —делать архив записи (Make zip file of record)
Ј ѕомощь (Help)
»нструмент Navigation позвол€ет перемещатьс€ внутри записи и между запис€ми.
ƒл€ сохранени€ записи в Excel необходимо в окне Toolbox выбрать Plot wavefoprm, найтиинтересующую ¬асбазу данных, запись и временной интервал. «атем в окне Toolbox выбрать Export signals as SCV, далее может быть 2 варианта действий.
|
|
|
1) скопировать массив значений времени и напр€жени€, открыть новый лист Excel и вставить туда содержимое буфера. ¬се данные окажутс€ скопированными в столбец Ђјї.
2) Ќажать ссылку>samples.csv в окне The output below was prepared using this command: Ц данные окажутс€ скопированными в один столбец новой книги ЂSamplesї Excel

¬ыделить столбец с данными в Excel, ¬ойти в меню ƒанные, “екст по столбцам. Ќа первом шагеуказать формат данных Ц с разделител€ми.

Ќа втором шаге указать символ-разделитель Ц зап€тую
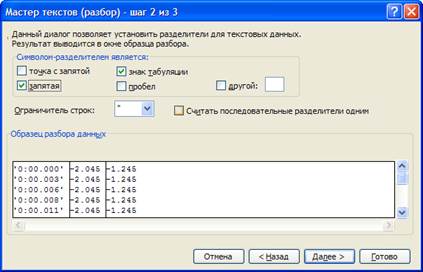
“ретий шаг Ц все установки по умолчанию

ѕолучим несколько столбцов в первом Ц врем€, в остальных напр€жение (в каждом столбце свое отведение).
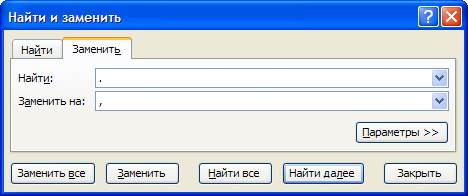
ƒалее необходимо во всем массиве заменить точки на зап€тые использу€ меню ѕравка, «аменить.
ƒл€ получени€ входного файла дл€ работы с LabVIEW (что бы он мог читатьс€ Е..) необходимо скопировать значени€ напр€жений (один или несколько столбцов) сохранить в Ѕлокноте как текстовый файл с расширением.txt и кодировкой ANSI. «атем помен€ть расширение файла на.lvm. “еперь этот файл будет загружатьс€ в LabVIEW

