


„асто в машинном зрении примен€ютс€ автоматические измерени€ различных геометрических параметров с применением технологии захвата и обработки изображений. »змерение угла и определение точки пересечени€ двух элементов некоторой конструкции выполн€етс€ с использованием функции bwtraceboundary, котора€ реализует также автоматическое отслеживание границ.
—одержание Ј Ўаг 1: —читывание изображени€.Ј Ўаг 2: ќпределение области интереса.Ј Ўаг 3: ѕорогова€ обработка изображени€.Ј Ўаг 4: ѕоиск начальных точек каждой границы.Ј Ўаг 5: ќтслеживание границ.Ј Ўаг 6: ѕодгонка линий границ.Ј Ўаг 7: ќпределение угла пересечени€.Ј Ўаг 8: ѕоиск точки пересечени€.Ј Ўаг 9: ќтображение результатов. Ўаг 1: —читывание изображени€. —читаем изображение из графического файла gantrycrane.jpg и определим область интереса при решении этой задачи. Ёто изображение портала подъемного крана. RGB=imread('gantrycrane.png');imshow(RGB);text(size(RGB, 2), size(RGB, 1)+15, 'Image courtesy of Jeff Mather',... 'FontSize', 7, 'HorizontalAlignment', 'right');line([300 328], [85 103], 'color', [1 1 0]);line([268 255], [85 140], 'color', [1 1 0]);text(150, 72, '»змерение углов', 'Color', 'y',... 'FontWeight', 'bold');
Ўаг 2: ќпределение области интереса. ¬ырежем изображение, содержащее только те элементы конструкции крана, угол между которыми мы хотим определить. ƒалее необходимо определить контур двух металлических конструкций.
% оординаты области интереса можно задать вручную,% далее отображаем нужную область с помощью imviewstart_row=34;start_col=208;cropRGB=RGB(start_row:163, start_col:400,:);imshow(cropRGB)offsetX=start_col-1;offsetY=start_row-1;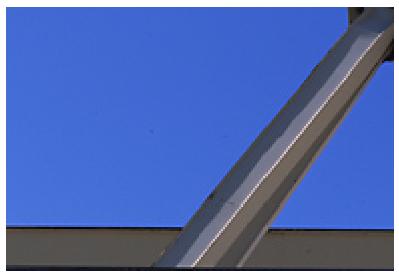
Ўаг 3: ѕорогова€ обработка изображени€. ѕреобразуем исследуемое изображение в бинарное. ƒалее эти бинарные данные будут использованы дл€ получени€ координат границ с помощью функции bwtraceboundary.
I=rgb2gray(cropRGB);threshold=graythresh(I);BW=im2bw(I, threshold);BW=~BW; % дополнение изображени€ (объект интереса должен быть белым)imshow(BW)
‘ункци€ bwtraceboundary позвол€ет реализовать также процедуру определени€ координат граничных точек. ƒл€ увеличени€ достоверности вычисленных углов и точек при расчетах нужно использовать максимальное число исследуемых граничных точек. Ёто число определ€етс€ экспериментально. ѕри проведении процедуры определени€ координат границ также необходимо указывать направление отслеживани€.
boundary1=bwtraceboundary(BW, [row1, col1], 'N', 8, 70);% установим направление отслеживани€ - против часовой стрелки, сверху внизboundary2=bwtraceboundary(BW, [row2, col2], 'E', 8, 90,'counter');imshow(RGB); hold on;% отображение результатов на исходном изображенииplot(offsetX+boundary1(:, 2), offsetY+boundary1(:, 1), 'g', 'LineWidth', 2);plot(offsetX+boundary2(:, 2), offsetY+boundary2(:, 1), 'g', 'LineWidth', 2);

